Determining the State of the Practice in Data Collection and Performance Measurement of Stormwater Best Management Practices
DTFH61-11-D-0032-P12-001
Printer-friendly PDF Version (1.7 MB)
Framework Report
November 2014

Notice
This document is disseminated under the sponsorship of the U.S. Department of Transportation in the interest of information exchange. The U.S. Government assumes no liability for the use of the information contained in this document. This report does not constitute a standard, specification, or regulation. The U.S. Government does not endorse products of manufacturers. Trademarks or manufacturers’ names appear in this report only because they are considered essential to the objective of the document.
Quality Assurance Statement
The Federal Highway Administration (FHWA) provides high-quality information to serve Government, industry, and the public in a manner that promotes public understanding. Standards and policies are used to ensure and maximize the quality, objectivity, utility, and integrity of its information. FHWA periodically reviews quality issues and adjusts its programs and processes for continuous quality improvement.
|
Technical Report Documentation Page
1. Report No.
FHWA-HEP-16-021
|
2. Government Accession No.
|
3. Recipient's Catalog No.
|
|
4. Title and Subtitle
Determining the State of the Practice in Data Collection and Performance Measurement of Stormwater Best Management Practices
|
5. Report Date
November 2014
|
|
6. Performing Organization Code
|
|
7. Author(s)
Michelle Mayfield, Karthik Narayanaswamy, Ph.D., David Jackson
|
8. Performing Organization Report No.
|
|
9. Performing Organization Name and Address
Cambridge Systematics, Inc.
100 Cambridge Park Drive, Suite 400
Cambridge, MA 02140
URS Corporation
1600 Perimeter Park Drive, Suite 400
Morrisville, NC, 27560
|
10. Work Unit No. (TRAIS)
|
|
11. Contract or Grant No.
DTFH61-11-D-0032-P12-001
|
|
12. Sponsoring Agency Name and Address
U.S. Department of Transportation
Federal Highway Administration
Office of Planning, Environment, and Realty
1200 New Jersey Ave SE
Washington, DC 20590
|
13. Type of Report and Period Covered
Final Report
|
|
14. Sponsoring Agency Code
HEPE-1
|
|
15. Supplementary Notes
FHWA Task Manager (COTR), Susan Jones
|
|
16. Abstract
This report assesses the state of the practice of data collection and performance measurement in stormwater programs at state Departments of Transportation (DOTs). Specifically, this study evaluated if performance measures for stormwater could be developed for use in performance-based planning and programming, for both construction-phase as well as post-construction application of BMPs.
Stormwater runoff has been identified as one of the major causes of surface water impairment. Resource agencies may assume that transportation-related runoff plays a major role, despite the fact that highways may comprise a small portion of the overall watershed. Additionally, managing stormwater assets is a component of the broader asset management activities performed by state DOTs. Quantitative measures to evaluate stormwater performance would support compliance and program efficiency.
The project team developed a feasibility assessment process to analyze potential stormwater-related performance measures to quantify beneficial stormwater program practices. The protocol included an analysis of state of the practice from a literature review and interviews with staff at eight state DOTs. The protocol was applied to a variety of stormwater topics, resulting in seven performance measures that were recommended for further evaluation by a panel of state DOTs.
|
|
17. Key Words
Stormwater, performance measures, performance-based planning, best management practices
|
18. Distribution Statement
No restrictions.
|
|
19. Security Classif. (of this report)
Unclassified
|
20. Security Classif. (of this page)
Unclassified
|
21. No. of Pages
86
|
22. Price
N/A
|
Form DOT F 1700.7 (8-72) - Reproduction of completed pages authorized
Determining the State of the Practice in Data Collection and Performance Measurement of Stormwater Best Management Practices
Table of Contents
Executive Summary
1.0 Introduction
2.0 Feasibility Assessment Process
2.1 Performance-Based Planning and Programming Framework
2.2 Challenges to Performance-Based Stormwater Management
2.3 Performance Measures and Compliance Risk
2.4 Process to Assess New Stormwater Performance Measures
2.5 Data Collection Methodology
2.6 Preliminary Assessment Factors
3.0 Preliminary Assessment of Feasibility
3.1 BMP Inspection and Maintenance
3.2 BMP and Outfall Inventory
3.3 Post-construction BMP Implementation
3.4 Employee and Contractor Training
3.5 Erosion and Sediment Control
3.6 Stormwater Management at Maintenance Yards, Depots, and Shops
3.7 Non-Structural BMPs
3.8 Impaired Waters and TMDLs
3.9 Topics Not Suited For Performance Measurement
4.0 Conclusions
4.1 Collaborative Development of Performance Measures
4.2 Research Projects Needed to Develop Additional Resources
4.3 Protocols and Guidance Needed
4.4 New Tools Needed
5.0 References
Back to top
List of Tables
Table 2.1 Example Performance Measures Adopted by State DOTs
Table 3.1 Assessment of inspection and maintenance performance measures
Table 3.2 Assessment of BMP inventory performance measures
Table 3.3 Assessment of BMP implementation performance measures
Table 3.4 Assessment of stormwater training performance measures
Table 3.5 Assessment of erosion and sediment control performance measures
Table 3.6 Industrial components tracked within transportation-related stormwater programs as reported in USEPA's ICR
database
Table 3.7 Excerpt from WSDOT's Gray Notebook showing trend in SWPPP implementation
Table 3.8 Assessment of watershed planning performance measures
Table 3.9 Tracking of non-structural BMPs
Table 3.10 Assessment of non-structural BMP performance measures
Table 3.11 Assessment of non-structural BMP performance measures
List of Figures
Figure 2.1 Performance Based Planning and Programming Framework
Figure 2.2 Feasibility Assessment Process for Stormwater Performance Measures
Figure 2.3 State DOT Participation in Study Interviews
Figure 3.1 Maryland SHA Field Tool Screenshot
Figure 3.2 Excerpt of Oregon DOT’s Stormwater BMP Inventory
Figure 3.3 Excerpt of Massachusetts DOT’s Water Quality Data Form
Figure 3.4 Staff training matrix used by Arizona DOT
Figure 3.5 Excerpt from Caltrans Annual Report
Figure 3.6 Example of tracking percent compliance by area of concern
Figure 3.7 Massachusetts DOT salt use vs. average statewide winter severity index
Back to top
List of Acronyms
| AASHTO |
American Association of State Highway and Transportation Officials |
| BMP |
Best management practices |
| Caltrans |
California Department of Transportation |
| CCEP |
Construction compliance evaluation plan |
| CDOT |
Colorado Department of Transportation |
| DCSWC |
District Construction Stormwater Coordinator |
| DOT |
Department of Transportation |
| FHWA |
Federal Highway Administration |
| GIS |
Geographical information systems |
| ICR |
Information Collection Request |
| JLSLAT |
Jordan Lake Stormwater Load Accounting Tool |
| LOS |
Level of service |
| MMS |
Materials management system |
| MS4 |
Municipal separate storm sewer system |
| NCHRP |
National Cooperative Highway Research Program |
| NHI |
National Highway Institute |
| NOV |
Notice of violation |
| NPDES |
National Pollutant Discharge Elimination System |
| NTPEP |
National Transportation Product Evaluation Program |
| PBPP |
Performance-based planning and programming |
| QAPP |
Quality assurance project plan |
| RWIS |
Road Weather Information System |
| SELDM |
Stochastic Empirical Dilution Model |
| SFID |
Stormwater Features Inventory Database |
| SHA |
State Highway Administration |
| SPCC |
Spill Prevention, Control and Countermeasure |
| SWIT |
Stormwater Inspection Tool |
| SWPPP |
Stormwater pollution prevention plans |
| TAPE |
Technology Assessment Protocol – Ecology |
| TMDL |
Total maximum daily load |
| USEPA |
United States Environmental Protection Agency |
| USGS |
United States Geological Survey |
| WPCP |
Water pollution control plan |
| WSDE |
Washington State Department of Ecology |
| WSDOT |
Washington State Department of Transportation |
Back to top
Acknowledgements
Valuable information for the development of this document was provided by state Department of Transportation (DOT) employees who took time to participate in interviews with project staff. This often required responding to pre-interview questionnaires, participating on telephone calls, and providing information requested after the call. The project team is grateful for the considerable time expended by the following practitioners:
| Wendy Terlizzi |
Arizona DOT |
| Leigh Waite |
Arizona DOT |
| Tom Boyce |
Colorado DOT |
| Bob McDade |
Colorado DOT |
| Mike Banovich |
Colorado DOT |
| Al Gross |
Colorado DOT |
| Rick Willard |
Colorado DOT |
| Fred Noble |
Florida DOT |
| Rick Renna |
Florida DOT |
| Tim Allen |
Florida DOT |
| Karuna Pujara |
Maryland State Highway Administration |
| Dana Havlik |
Maryland State Highway Administration |
| Cornelius Barmer |
Maryland State Highway Administration |
| Henry Barbaro |
Massachusetts DOT |
| Alex Murray |
Massachusetts DOT |
| Steve Miller |
Massachusetts DOT |
| Gayle Unruh |
Missouri DOT |
| Buck Brooks |
Missouri DOT |
| Melissa Scheperle |
Missouri DOT |
| Nate Muenks |
Missouri DOT |
| William Fletcher |
Oregon DOT |
| Seth McClure |
Wisconsin DOT |
The project team is also thankful to the external reviewers who provided comments on the draft report and guidance over the course of the project:
| Marlys Osterhues |
Federal Highway Administration |
| Kate Kurgan |
AASHTO |
The project team is also grateful for guidance, direction, and oversight provided by Susan Jones, Marcel Tchaou, and Brian Smith of the Federal Highway Administration through the course of this project.
Back to top
1.0 Introduction
The objective of this research project is to assess the state of practice of data collection and performance measurement in stormwater management programs at state Departments of Transportation (DOTs). Specifically, this study evaluates if it is feasible to develop performance measures for stormwater that state DOTs can use in performance-based planning and programming. The study focused on both construction-phase as well as post-construction application of BMPs to protect water quality.
This report outlines a feasibility assessment process developed to analyze this question. The protocol consists of two parts: a preliminary assessment component; and a collaborative development component. The preliminary assessment component, included in this report, is a compilation of available information and analysis of feasibility based on the data gathered. A future project will bring state DOT participants to review and validate this information and identify appropriate performance measures for implementation through the collaborative development component.
Performance management is a strategic approach to use quantifiable data, known as performance measures, as part of the ongoing operation to make investment and policy decisions to achieve goals, and to improve communication of choices and approaches with decision makers, stakeholders and the public. Performance management is credited with improving project and program delivery, informing investment decision-making, focusing staff on leadership priorities, and providing greater transparency and accountability to the public (FHWA, 2013). Performance management has successfully been applied in a variety of subject areas, including safety and pavement maintenance.
In order to implement a performance management system, state DOTs must identify performance measures that will support the agency’s goals and objectives. Some state DOTs have already defined and applied internally developed performance measures. However, there are benefits to collaborating on performance measures that can be adopted by interested state DOTs, including:
- State DOTs do not need to perform the evaluation of usefulness and develop data management protocols individually but can leverage the experience of their peers;
- Agencies can learn from the best practices of other state DOTs in using performance measures for decision-making, policy and investment choices;
- Communication with state environmental resource agencies can be improved if the measures are commonly adopted and have been successfully applied by other state DOTs; and
- Upper management can chose to compare program performance with peer agencies and recognize if there is a need for greater funding or manpower to their program.
Stormwater runoff has been identified as one of the major causes of surface water impairment. Resource agencies may assume that transportation-related runoff plays a major role, despite the fact that highways may comprise a small portion of the overall watershed. Many DOTs have one or more National Pollutant Discharge Elimination System (NPDES) permits such as separate permits for their municipal separate storm sewer system (MS4) discharges and their construction activities, as well as other environmental permits requiring stormwater management best management practices (BMPs). The United States Environmental Protection Agency (USEPA) has identified stormwater runoff from transportation systems as being one of its focus points to improve water quality under the Clean Water Act (Nagle, 2014).
Additionally, managing stormwater assets is a component of asset management. One issue that state DOTs have faced is determining resource allocation needs and communicating this information in a defensible fashion to upper level management. Without quantitative measures of asset performance, state DOT stormwater managers are often asked to do more with less funding.
A recent review of performance measures under the National Cooperative Highway Research Program (NCHRP) in a variety of subject areas identified stormwater performance measurement as a research area (Cambridge Systematics, 2011). It recommended additional evaluation of the possible performance measures and engaging practitioners to review and provide input on this subject area. The present research project is the first step in this process.
The reader is cautioned that the preliminary assessment in this report was based on information that was publically available or provided by state DOT staff who were interviewed for this report. This information will be reassessed during the collaborative development process, which allows an opportunity for more information to be collected (if necessary) and assessed with input from state DOTs and other stakeholders. This report focuses on applicability and feasibility, but does not consider the following topics:
- Policy sensitivity;
- Specific goals for state DOTs and the extent to which performance measures address those goals; and
- Costs associated with new recordkeeping and reporting systems required to implement performance measurement.
These questions will be addressed initially during the future collaborative development process, but also independently by each state DOT when it makes a determination of whether or not to implement performance measures as part of the performance-based planning and programming process.
Back to top
2.0 Feasibility Assessment Process
This section discusses the feasibility assessment process used to evaluate performance measurement options for stormwater topics. Specifically, the process serves as a roadmap to evaluate data gathering by state DOTs and identify opportunities for collaborative development of standardized definitions of performance measures and consistent data management procedures.
The feasibility assessment process presented in this study is based on concepts and lessons learned from FHWA’s performance management approach and performance-based planning and programming (PBPP) framework. This section includes an overview of the PBPP, and discusses why developing performance measures for stormwater is challenging.
2.1 Performance-Based Planning and Programming Framework
PBPP refers to the application of performance management within the planning and programming processes of transportation agencies to achieve desired performance outcomes for the multimodal transportation system. FHWA has developed a framework for PBPP, presented in Figure 2.1 that includes identifying strategic goals and objectives, selecting performance measures, and planning for continual improvement based on the results of monitoring performance against established targets.
One of the key initial steps in PBPP for a new subject area is identifying appropriate performance measures. FHWA (2013) identifies five critical purposes for performance measures within PBPP:
- Clarify the definition of goals: Performance measures are a tool that is used in converting broad goals into measurable objectives;
- To monitor or track performance over time: Metrics are used to track performance on a regular basis (e.g., yearly, monthly);
- As a reference for target setting: Metrics are used as the basis for selecting a target that is intended to be achieved;
- As a basis for supporting policy and investment decisions by comparing alternative options: Metrics are used as a basis for comparing alternative investments or policies in order to make decisions; and
- To assess the effectiveness of projects and strategies: Metrics are what enable measurement to assess whether projects and strategies have worked to further goals.
Figure 2.1 Performance Based Planning and Programming Framework
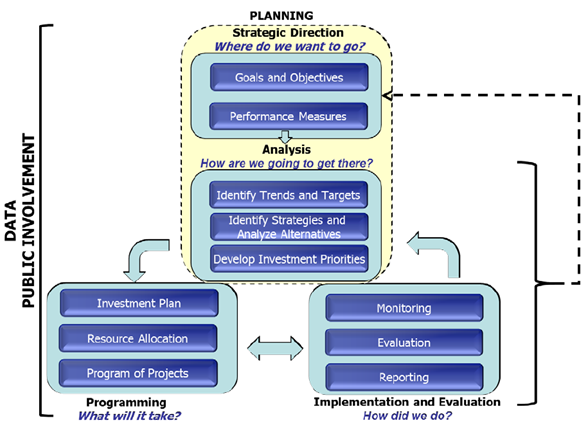
Source: FHWA (2013).
Back to top
2.2 Challenges to Performance-Based Stormwater Management
PBPP has been successfully applied in areas where there have been substantial development of approaches used to define the measures and validate data, in the use of shared national databases, and with the implementation by several state DOTs of data-based decision-making processes. In general, performance measures that are compatible for nationwide application possess the following three attributes:
- General consensus on definition of the measure;
- Common or centralized approach to data collection; and
- Availability of consistent data across states.
Stormwater management is faced with several challenges which impede the widespread implementation of nationwide performance measures for stormwater, including:
- Lack of consistent site-specific environmental needs: The stormwater treatment needs on a project are driven in part by the size and existing impairment status of the receiving stream, as well as other environmental concerns such as threatened and endangered species, and wetlands. These variations can cause considerable inconsistencies in the implementation of BMPs across the country and even within a state or region of a state.
- Lack of national data collection process: Performance measurement initiatives in other practice areas have been able to leverage centralized data collection systems such as the Highway Performance Monitoring System, a nationwide FHWA inventory system that includes data for all of the Nation's public road mileage on an annual basis; and the Fatality Analysis Reporting System, a centralized database tracking highway fatality and injury information. There is no single, consistent, practitioner supported data collection process or reporting database for stormwater.
- Lack of data regarding resource needs: Data collection by state DOTs has generally been specific to a project or individual activity, and is often driven by regulatory requirements specific to that state DOT. Few state DOTs compile specific cost or manpower data on a variety of stormwater topics. This in turn reduces the current ability to base decisions and policy on performance measures.
- Lack of consistent regulatory program requirements: The key driver of most stormwater programs is compliance with the Clean Water Act. However, the specific requirements are influenced by the type of permit each state DOT has been issued by the environmental resource agency, such as Phase I NPDES, individual Phase II NPDES, or general Phase II NPDES permits. In addition, permits issued to state DOTs have a variety of special requirements that reflect the particular stormwater concerns of the state resource agency and are not consistent nationwide.
- Lack of personnel and funding: The focus of most state DOTs is providing safe and reliable transportation options, with environmental concerns as an important consideration. State DOTs may lack personnel and funding for improvement of some environmental programs. Of course, this is also an avenue where state DOTs could benefit from performance measurement as a tool to communicate with upper level management to discuss funding needs.
Some of the limitations discussed above are the result of the need for flexibility for state DOTs in developing their stormwater programs. Regulatory agencies have recognized this need for flexibility, although concurrence on how to implement BMPs varies greatly nationwide. The Clean Water Act §402(p)(3)(B)(iii) requires the following:
“[p]ermits for discharges from municipal storm sewers [to] require controls to reduce the discharge of pollutants to the maximum extent practicable, including management practices, control techniques and system, design and engineering methods, and such other provisions as the Administrator or the State determines appropriate for the control of such pollutants.”
Both site-specific and programmatic requirements are evaluated by regulatory agencies using the concept of maximum extent practicable. The Effluent Limitations Guidelines and Standards for the Construction and Development Point Source Category (published in 2014) recognizes the need for flexibility in implementing appropriate BMPs by including the term infeasible in the rulemaking. When a required BMP is determined to be infeasible, the regulated entity must substitute an alternative effective BMP.
Back to top
2.3 Performance Measures and Compliance Risk
Regulations are one of the primary drivers for stormwater programs. Therefore, suggested performance measures may be compliance-focused. Some state DOTs may be concerned that poor results for performance measures may expose them to greater risks for enforcement or audits by USEPA or state environmental resource agencies.
Not measuring compliance does not reduce these risks. Instead, it prevents state DOT staff from identifying deficiencies and engaging upper-level management on additional resources needed to support permit compliance. Indeed, a central tenet of the NPDES stormwater program is continual process improvement and self-reporting on impacts to water quality. State environmental resource agencies are often supportive of and expect permittees to quantify program success as long as the state DOT is directing resources to improving the identified deficiencies.
Given the regulatory nature of stormwater, compliance-oriented performance measures were not excluded from consideration. Nevertheless, each state DOT will have to evaluate its own regulatory climate and policy sensitivity before implementing these performance measures.
Back to top
2.4 Process to Assess New Stormwater Performance Measures
To evaluate the feasibility of stormwater performance measures nationwide, a process is necessary to consider the current state of the practice and identify potential performance measures.
The proposed feasibility assessment process is shown in Figure 2.2, and consists of two components:
- The preliminary assessment refers to the desktop process of evaluating existing stormwater data management practices and performance measurement at state DOTs in order to determine the feasibility of implementing stormwater performance measures. The purpose of the preliminary assessment is to screen for feasible measures that may be elevated to the collaborative development phase and also identify future research needs.
- The collaborative development involves convening a Collaborative Development Panel including stakeholders from FHWA and a selection of state DOTs to evaluate the information from the preliminary assessment phase, validate the information against their experience, obtain feedback on program drivers and usefulness in decision-making, and determine a path forward towards standardized definitions of performance measures.
Figure 2.2 Feasibility Assessment Process for Stormwater Performance Measures
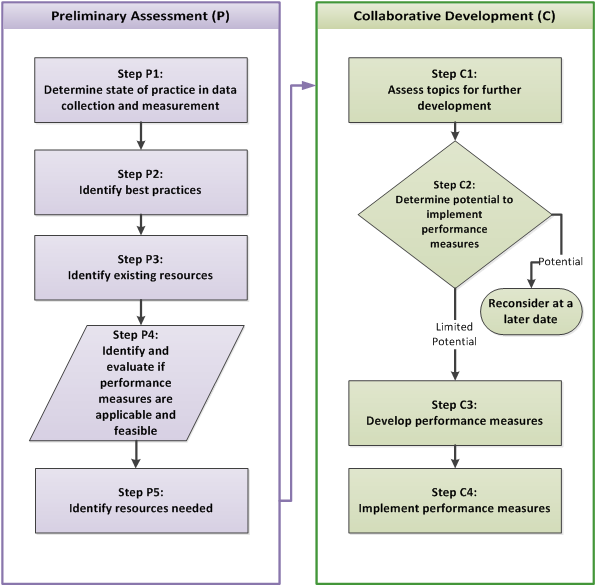
Source: URS, 2014.
The steps involved in the feasibility assessment process are as follows:
Preliminary assessment steps:
P1. Determine the state of the practice in data collection and measurement: Based on the literature review and interviews, develop an understanding of where the state DOT community is in terms of data collection and management and use of data in decision‑making.
P2. Identify best practices: Identify effective strategies used by state DOTs to manage data and how the data is used to support policy and resource allocation.
P3. Identify existing resources: Identify existing national resources that can be readily used by state DOTs to support stormwater program activities.
P4. Identify and evaluate if example performance measures are applicable and feasible: Assess potential performance measures in the topic area with respect to applicability to and feasibility for performance-based planning.
P5. Identify resource needs: Propose projects that address data gaps or additional information needed to support development of future performance measures, identify protocols, methods and tools that need to be developed.
Collaborative development steps:
C1. Assess topics for further development: Convene the Collaborative Development Panel to review information from the preliminary assessment, identify challenges and opportunities, collaborate on data collection methods, and commit to baseline data monitoring.
C2. Determine the potential to implement: Evaluate feasibility based on feedback from the Collaborative Development Panel and any baseline data monitoring conducted by participating state DOTs.
C3. Develop performance measures: Develop performance measures based on baseline data, including development of standardized definitions of the performance measures and guidance on data collection, management, and reporting.
C4. Implement performance measures: Implement selected performance measures into performance-based planning programs.
This report provides a discussion of the preliminary assessment where sufficient information was available to assess the stormwater topic. However, the ratings assigned in this report are screening results based on available information, and it is possible that some of the measures that were highly rated during this exercise will be deemed infeasible during collaborative development. The purpose of this screening is to develop a short list of performance measures to be reviewed by the Collaborative Development Panel.
Although the feasibility assessment process includes steps for collaborative development, the collaboration is outside the scope of this project.
Back to top
2.5 Data Collection Methodology
As part of the preliminary assessment, the project team followed a step-wise data collection and assessment process, which consisted of the following:
- Literature review;
- State DOT interviews;
- Feasibility approach; and
- Topic assessment.
The first step of the process was a review of publically available information from 50 state DOTs. The purpose of the literature review was to identify candidates for the interview stage of the project. Some of the parameters of the literature review included:
- Existence of protocols or manuals;
- Information available on data collection and management;
- Use of performance measures to support decision-making;
- Innovative approaches to stormwater management; and
- Regulatory history including amount of time under an MS4 NPDES permit and notices of violation (NOV) received.
The literature review covered a broad range of stormwater topics, including but not limited to: implementation of structural and non-structural BMPs, use of internal audit programs, protocols for source control and maintenance, environmental management systems, and interaction with state environmental resource agencies.
A second source of data was provided by USEPA from their Information Collection Request (ICR) for Proposed Rulemaking to Strengthen the Stormwater Program. Data from USEPA’s Transportation MS4s questionnaire was provided confidentially to support the development of this study. Under the terms of the data sharing agreement, this study discusses only summary information from the ICR dataset, but does not divulge any state DOT-specific information.
Based on the literature review, the project team selected eight state DOTs for interviews, which are shown in Figure 2.3. The interviews helped verify data collected during the literature review and provided better understanding of specific procedures and approaches adopted by the state DOTs for various stormwater topics.
Figure 2.3 State DOT Participation in Study Interviews
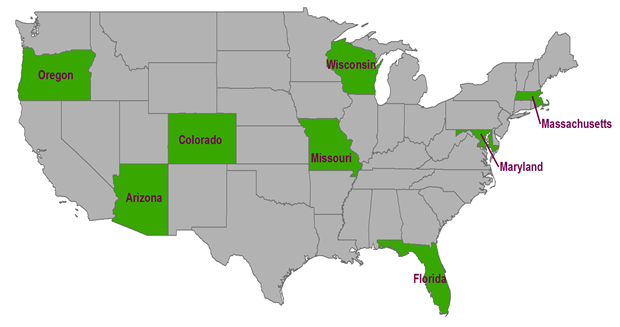
Source: URS, 2014.
The project team coordinated with each state DOT in Figure 2.3 to compile information ahead of the interview. Each interview was limited to three to five stormwater topics to allow for more in-depth discussion of selected topics during the telephone call.
Data collected from the literature review and interviews were used in the preliminary assessment phase of this framework presented in Section 3. Since the literature review was only a top-level review, and only a small percentage of state DOTs were interviewed in detail on any given topic, the data collected may not always be representative of all state DOTs. For this reason, it is important that some of the members on the Collaborative Development Panel should be from state DOTs other than those interviewed.
Back to top
2.6 Preliminary Assessment Factors
The purpose of the preliminary assessment is to evaluate the types of data being collected and the management approaches within state DOTs, and to evaluate the feasibility of developing performance measures for a variety of stormwater topics.
Some state DOTs currently implement performance measures, some of which are presented in Table 2.1. However, these are mostly focused on compliance, with the most common measure being the number of violations. While this is an appropriate management concern, effectively managing a stormwater program requires managers to focus in greater detail on measures that have predictive value.
Table 2.1 Example Performance Measures Adopted by State DOTs
| Agency Name |
Example Performance Measure |
| Colorado DOT |
- Number of environmental compliance violations
|
| Maine DOT |
- Percent closure of corrective actions from audits within 12 months
- Number of facilities audited every three years
|
| Maryland SHA |
- Number of stormwater management locations that are functioning as designed
- Number of stormwater management locations with major maintenance or repair needed
- Percent of compliance on erosion and sediment projects
- No. of facilities with non-compliance findings
|
| New Hampshire DOT |
|
North Carolina
DOT |
- Average level of compliance with Sedimentation Pollution Control Act
- Average level of service for post-construction BMPs
|
| Virginia DOT |
- Percentage of environmental projects listed as being in compliance
- Number of state environmental review projects initiated on schedule
|
| Washington State DOT |
- % stormwater outfalls mapped
- Number of stormwater pollution prevention plans implemented
- Average turbidity from construction site stormwater monitoring
- Number of stormwater management facilities constructed
|
Additionally, the project team wanted to focus on performance measures that were sufficiently broad to be applicable to state DOTs nationwide. While individual state DOTs may have specific concerns, development of consistent nationwide performance measures requires focus on larger programmatic metrics that influence program implementation. Individual state DOTs may choose to adopt additional performance measures based on local or organizational concerns.
To support this evaluation for nationwide performance measures, the project team developed the following six assessment factors to evaluate example performance measures for each stormwater topic considered:
- Improvements in the measure are expected to improve water quality;
- The measure can be used to inform policy-making and determine manpower and funding needs;
- The measure is flexible enough to allow changes over time as technology and regulations change, with little change to the meaning of historical data;
- The data that needs to be collected to support the measure is defined;
- It is feasible and practical to collect, store, and report data; and
- The data is or can be collected within existing programs.
For each stormwater topic, the project team considered one or more candidate performance measures. Each performance measure was then evaluated against the six assessment factors listed above, using a scale of 1 to 5, where 5 indicated strong agreement based on literature review and state DOT interviews, and 1 indicated strong disagreement based on the data collection in this project. It is important to recognize this scoring is preliminary only and must be subject to validation in the future Collaborative Development process.
As an example, consider the first assessment factor, “Improvements in the measure are expected to improve water quality” and two measures presented as examples:
- The total load of a parameter of concern has a strong impact on water quality, so this measure would be rated highly.
- The total lane-miles of highway that have been mapped in Geographical Information Systems (GIS) does not have a direct impact on water quality. While mapping right-of-way is an important element of a stormwater program, it does not by itself affect water quality. This measure would be rated poorly.
The ratings for each assessment factor were added to compute a total score for each performance measure (with a maximum possible of 30 points), which was used to rank the performance measures in Section 4.
Back to top
3.0 Preliminary Assessment of Feasibility
This section applies the preliminary assessment process, shown in Figure 2.2, to a selection of stormwater topics. The topics were selected to represent the breath of stormwater program issues affecting the majority of state DOTs for which information was collected during this project. Each topic includes one to three candidate performance measures. These are measures that have either been implemented by one or more state DOTs, or that are considered preliminarily possible to track based on the types of data state DOTs collect. Section 3.9 also discusses topics that were deemed to be not suitable for performance measurement.
3.1 BMP Inspection and Maintenance
Inspection and maintenance are essential for maximizing asset performance. Since post-construction BMPs are physical assets, state DOTs need manpower and funding resources to manage the BMPs. Many state DOTs have developed programs to inspect if BMPs are functioning as expected, and perform maintenance when needed. These inspection and maintenance programs are intended to promote efficient operation of BMPs and are frequently requirements of NPDES permits for state DOTs. Several state DOTs have established specific frequencies for inspection of stormwater BMPs.
Climatic and geographical differences across the country lead state DOTs to develop specific protocols for inspecting and maintaining different BMP types that work well for their local conditions. These conditions might include bedrock or groundwater close to the surface, soils that do or do not promote infiltration, and soils that are easily erodible. Therefore, the focus of nationwide performance measurement should be at the programmatic level rather than seeking to establish common standards for inspection and maintenance.
An example was state DOTs measuring the percentage of required BMP inspections completed. Each state DOT would establish the required inspection frequencies for each BMP type independently, reflective of individual agency concerns, but the definition of the performance measure is consistent nationwide. For this reason, the discussion below is focused on the types of data collected by the state DOTs rather than specific protocols for inspection and maintenance.
Step P1: Determine the BMP inspection and maintenance state of the practice
State DOTs adopt different levels of data management in their post-construction BMP inspection and maintenance programs. The eight interviewed state DOTs ranged from having no specific goals or tracking methods to having sophisticated data gathering tools and protocols. This variability reflects the diversity of stormwater program drivers which include regulatory requirements, resource availability, and organizational structure.
Thirty-six state DOTs indicated in the USEPA ICR database that they perform routine inspections of post-construction stormwater BMPs. The majority of these respondents indicated they also track these inspections, although only 15 state DOTs reported having a formal tracking database of inspection activities.
Some state DOTs tracked BMP inspections and maintenance in a standalone database, while others used existing resources like the state DOT’s maintenance management system (MMS). Generally, state DOTs that used an MMS tended to classify stormwater activities to one or two activity codes. While consolidating activity codes in MMS results in more consistent coding by maintenance staff, it also results in a reduced amount of data available to identify recurring maintenance issues or problematic BMP types.
One challenge to inspection and maintenance tracking is decentralized responsibilities for maintenance. Maintenance at several state DOTs is under the purview of individual districts or may be let to contractors. Other state DOTs like the Wisconsin DOT have memoranda of agreements with local municipalities for certain maintenance functions like street sweeping. This complicates data gathering efforts, since internal and external stakeholders must reach a data sharing agreement to collect and compile appropriate data. Stakeholders must also agree upon performance goals and targets, and negotiate a cost-sharing agreement for implementing new data collection methods.
Step P2: Identify best practices for inspection and maintenance
State DOTs adopted a variety of best practices for BMP inspection and maintenance data management. The following is a list of some effective strategies:
Mobile Devices to Support Inspections
Colorado DOT (CDOT) implemented a Stormwater Inspection Tool (SWIT) that integrates geospatial and historical inspection data in a software platform accessible in the field from a laptop. Inspectors are able to review this data and record information from inspections, which are then used to update the inspection database. Data from SWIT can be imported into SAP® (CDOT’s enterprise resource planning system). Consolidating these two resources allows inspection and maintenance activities to be associated with individual BMPs and allows CDOT to evaluate maintenance expenditures for each BMP. Additionally CDOT can identify problematic BMPs such as those with recurring maintenance issues.
- Several state DOTs developed protocols to rate stormwater BMPs on a numeric or alphanumeric scale and used the average rating as a performance measure for adequate inspection and maintenance. One such example is discussed in the inset on the Maryland State Highway Administration (SHA) approach.
- Some state DOTs integrated BMP inventory data into GIS and provided field inspectors access to this information. Some state DOTs have adopted software platforms that the inspector can access in the field by a mobile device such as a tablet or laptop (see inset on Colorado DOT). Other state DOTs have developed electronic systems for inspectors to record their findings when they return to the office.
- Inspectors have a richer understanding of maintenance issues when they have access to previous site inspection results and maintenance history. This history may enable them to identify ongoing problems that need more extensive maintenance or upgrades to the BMP.
- One of the concerns with using a quantitative rating assigned by inspectors is consistency in classification between inspectors (e.g., one inspector may consider an activity a major repair where another inspector considers it a minor repair). One state DOT addressed this by not having the inspectors assign the ratings. Instead, a single well-trained group in the central office reviews inspection results from across the state and assigns a rating to the BMPs based on developed protocols.
- Other state DOTs address the concern of consistent rating application by extensive training of inspectors.
- At least one state DOT ties the inspection rating to the personnel performance reviews of the district staff responsible for maintaining the BMPs.
Step P3: Identify existing resources for inspection and maintenance
There are numerous guidance documents available on inspection and maintenance of BMPs. However, the focus of performance measurement is to manage inspection and maintenance data and quantify program success. The project team did not identify existing free, publically available resources that could be readily applied by state DOTs to managing inspection and maintenance data.
Step P4: Identify and evaluate if inspection and maintenance performance measures are applicable and feasible
To assess the viability of BMP inspection and maintenance performance measures, the project team chose the following three different metrics for evaluation:
Mobile Devices to Support Inspections
Maryland SHA developed a Field Evaluation Tool (shown in Figure 3.1) that allows inspectors to review existing GIS data and locate the appropriate BMP, review prior inspection records, and document inspections. The tool is also used to document other compliance information during the inspection, such as the existence of illicit discharges and potential concerns about the BMP condition. Each BMP is assigned an LOS rating based on the level of functionality which would range from a "1" indicating that the BMP is operating as designed and is a candidate for multi-year inspections, to a "5" indicating the BMP is not performing as intended and has a high potential for deterioration and failure. These ratings are rolled up to the District level and presented to the public as part of Maryland SHA’s annual StateStat report on performance measures.
Figure 3.1 Maryland SHA Field Tool Screenshot
Source: Maryland SHA (2012).
Note: Maryland SHA field tool screenshot showing a BMP (blue hatch) and associated drainage area (brown hatch).
- Average Level of Service (LOS) rating: This is an existing performance measure used by several state DOTs. This measure could be easily integrated into existing inspection programs.
- Percentage of inspections required by the state DOT that were actually completed: This measure assumes that state DOTs have defined an inspection frequency for each BMP type or can develop one.
- Percentage of program audited by state DOT within the last two years:Having an audit program confirms consistency of the inspections and strengthens the inspection program. This measure is intended to be flexible to the definition of an audit that each state DOT sets for itself. That is, one state DOT could limit its audit to reviewing recordkeeping, while another state DOT could evaluate the consistency of the LOS rankings assigned. The time period could also be adjusted from two years.
Table 3.1 evaluates the effectiveness of these performance measures using the assessment factors described in Section 2.
Table 3.1 Assessment of inspection and maintenance performance measures
| Assessment Factor |
Average Level of Service Rating |
% Required Inspections Completed |
% Program Audited by State DOT in Last Two Years |
|
Improvements in the measure are expected to improve water quality
|
5
|
2
|
2
|
|
The measure can be used to inform policy making and determine manpower and funding needs
|
3
|
4
|
4
|
|
The measure is flexible enough to allow changes over time as technology and regulations change, with little change to the meaning of historical data
|
4
|
4
|
2
|
|
The data that needs to be collected to support the measure is defined
|
3
|
4
|
3
|
|
It is feasible and practical to collect, store, and report data
|
4
|
4
|
3
|
|
The data is or can be collected within existing programs
|
3
|
3
|
2
|
|
Total Score
|
22
|
21
|
16
|
| Note: 5 is the highest ranking and 1 is the lowest ranking. |
The scores in Table 3.1 reflect the following considerations:
- Average Level of Service rating: While there are several elements that state DOTs need to stand up prior to implementing this measure, including a protocol to determine LOS and associated training, this measure offers a robust method to evaluate if there is adequate maintenance of BMPs and to adjust resource allocation accordingly.
- Percentage of inspections required by the state DOT that were actually completed: This measure has some policy sensitivity since it could be perceived as a compliance risk (see Section 2.3 for discussion of this topic). However, tracking this measure is relatively simple for state DOTs to implement and can impact funding and resource allocation materially. One downside is that simply knowing inspections were completed is not an indication of whether BMPs are functioning as designed.
- Percentage of program audited by state DOT within the last two years: An audit program allows state DOTs to verify if the LOS ratings being assigned by inspectors are appropriate, or if additional training is required. This measure validates the consistency of the program. However, few state DOTs currently have audit programs in place.
Step P5: Identify resource needs to support inspection and maintenance performance measures
To help facilitate performance measures for BMP inspection and maintenance, the following research projects should be considered:
- Develop a consistent and comprehensive protocol to classify LOS. For example, a standard scale (e.g., a rating of 1-5), a suggested rating criteria (e.g., 1 = Operating as Designed, No Issues Observed), and guidance on rating can be used to promote consistent comparison. Each state DOT could define its own criteria for issues that would result in a BMP rated as needing “major repairs” versus “minor repairs”, but the protocol should define some broad principles and suggest some typical examples.
- Develop a guidance document on inspection database architecture and a data maintenance and validation approach for state DOTs without a current inspection database that wish to implement one of their own. The proposed approach should discuss data sources that could be tied into the inspection database, such as a human resources database or asset management database, and be flexible enough to address a variety of regulatory requirements in addition to performance tracking.
- Conduct a study relating maintenance practices with water quality. This would help policymakers determine what an appropriate level of maintenance is while setting LOS targets and resource allocations. A relationship between maintenance practices and water quality could also be established through models as long as the models were supported by validation against real-world data.
- Develop guidelines for mobile solutions for inspection data management. Several state DOTs are looking at solutions on phones, tablets and laptops to help inspectors access various data sources and aggregate field inspection data into existing databases. Guidance is required to help state DOTs identify the different types of data to be incorporated (e.g., BMP inventory, geospatial data), database architecture, naming conventions, data attributes, standardized definitions, work flows, and standard quality assurance procedures. The advantage of standardizing this approach early on is to enable greater efficiency and sharing of resources among state DOTs, and to allow development of consistent performance measures in the future.
What can state DOTs do now to get started?
Prior to implementing one of these three performance measures – average LOS rating, percentage of required inspections completed, or percent of BMPs internally audited – a state DOT may need to develop some or all of the following tools:
- Stormwater BMP inventory, including appropriate design information for stormwater inspector to make determination if the BMP is operating “as designed;”
- Inspection and maintenance manual or guidance statement, including defined inspection schedule for each BMP type;
- Functional definitions for a system of LOS ratings;
- Training for inspectors to promote consistent categorization of BMP functionality;
- Internal audit process, including protocols and a standard audit frequency;
- Resource information including manpower and cost of inspection and maintenance activities to support decision-making; and
- Hardware and software to track inspection findings and maintenance activities.
Back to top
3.2 BMP and Outfall Inventory
Identification and tracking of stormwater outfalls is a common requirement of many MS4 NPDES permits, although the specific requirements can vary between state DOTs. The permits may also require inventories of structural BMPs, which a state DOT may track as part of its asset inventory. The goals of the outfall inventory requirements include:
- Help identify illicit discharges and illegal dumping. This is especially true in a municipal setting. State DOTs are often subject to the same requirements, even though identifying these illegal flows is far less likely in the DOT context.
- Help identify drainage areas. This is particularly useful if end-of-pipe BMPs are needed to reduce the impacts of upstream flows on stream health.
- Identify upstream activities that have the potential to impact the receiving stream. State DOTs might consider additional or different BMPs if the outfall downstream of the activity is within a certain distance (e.g., ¼ or ½ mile) of the activity. An example of this is North Carolina DOT’s practice of providing additional structural controls for the roadway draining to or within a ¼ mile of a lake or river that is a drinking water source.
BMP inventories are sometimes required by MS4 NPDES permits, but are often implemented as part of good asset management even if not required. Knowing where stormwater assets are located helps support various operations, including providing staff a list of BMPs to be inspected and maintained, estimating the state DOT’s pollutant load discharges and compliance with load reductions mandated by total maximum daily loads (TMDLs) and estimating funding levels to maintain these assets.
Step P1: Determine the BMP and outfall inventory state of the practice
According to the USEPA ICR dataset, 31 state DOTs indicated they had a database tracking or inventory of outfalls, and 29 of these agencies indicated that they also had storm sewer mapping. The majority of the state DOTs interviewed in this project were actively mapping their outfalls. Some state DOTs performed outfall inventories once, effectively making them a snapshot in time with no intention of updating them unless required by a future permit. In some cases, the outfall inventory was a desktop GIS exercise with no field verification.
Twenty two of state DOTs reporting to the USEPA ICR indicated they had a tracking mechanism for post-construction stormwater BMPs. Six of the eight interviewees in this project maintained inventories of post-construction BMPs. There is considerable variability in the level of information tracked, including location, receiving waters, watershed, contributing drainage area, water quality volume, cost of BMP construction, BMP type, and impervious cover.
Maintaining an inventory of post-construction BMPs is a key requirement in implementing performance measurement. Indeed, several example performance measures listed in this report would be supported by an inventory of BMPs.
Step P2: Identify best practices in BMP and outfall inventories
There is a variety of successful practices state DOTs use to compile and manage inventory data, including the following:
Inventory Database Development and Associated Protocols
Washington State DOT (WSDOT) maintains a Stormwater Features Inventory Database (SFID). The Department has developed detailed protocols to manage data collection and analysis. SFID data sources include scanned and georeferenced as-built drawings, GPS data collected by both stormwater and non-stormwater field crews, stormwater feature location and attribute information collected by WSDOT’s maintenance program, and design drawings.
It is beneficial to start with a simple inventory in Excel or similar application for ease of use (see inset on Oregon DOT’s inventory), and develop and track key performance indicators before developing more sophisticated dashboards.
- The BMP inventory supports other initiatives, so the information needs for different end users must be considered. For example, to judge the quality of maintenance on a stormwater BMP, the inspector must determine if the BMP is “functioning as designed”, which requires the inspector to have access to the design information. If the inventory does not have adequate metadata, it limits the value of the dataset. See inset on Washington State DOT’s use of different data sources for the BMP inventory.
- Some state DOTs have developed tools to query the outfall database by receiving stream, outfall type and state DOT District or facility.
- One state DOT reports through its public accountability website the percentage of highway miles that have stormwater outfalls mapped and the number of stormwater BMPs constructed.
Step P3: Identify existing resources for BMP and outfall inventories
The project team did not identify existing free, publically available resources that could be readily applied by state DOTs to support managing outfall and BMP data. There are commercial products available, although most state DOTs prefer to develop custom solutions.
Step P4: Identify and assess if inventory performance measures are applicable and feasible
To assess the viability of an inventory performance measure, the project team chose the following metrics for evaluation:
- Number of BMPs added to the inventory: This performance measure relates to the total number of BMPs in the inventory, with the inclusion of geospatial location, design information and other metadata.
- Percent of right-of-way with stormwater outfalls mapped: This performance measure relates to the extent of outfall identification and geolocation performed to date.
Simple Tracking of BMP Inventory
Establishing an inventory of BMPs does not have to be complex. Oregon DOT maintains its BMP inventory in a simple Excel spreadsheet (Figure 3.2), which is then used to “roll up” statistics to identify Districts which needed additional support. The inventory includes geographical information, BMP type, design plans location and information, date of construction, if operation and maintenance plans have been completed, specific maintenance requirements, and the location on the server of the project files.
Figure 3.2 Excerpt of Oregon DOT's Stormwater BMP Inventory
Source: Oregon DOT.
Table 3.2 evaluates the effectiveness of these performance measures using the assessment factors described in Section 2.
Table 3.2 Assessment of BMP inventory performance measures
| Assessment Factor |
Average Level of Service Rating |
% Required Inspections Completed |
|
Improvements in the measure are expected to improve water quality
|
3
|
1
|
|
The measure can be used to inform policy making and determine manpower and funding needs
|
4
|
4
|
|
The measure is flexible enough to allow changes over time as technology and regulations change, with little change to the meaning of historical data
|
5
|
4
|
|
The data that needs to be collected to support the measure is defined
|
5
|
4
|
|
It is feasible and practical to collect, store, and report data
|
5
|
4
|
|
The data is or can be collected within existing programs
|
5
|
3
|
|
Total Score
|
27
|
20
|
| Note: 5 is the highest ranking and 1 is the lowest ranking. |
The scores in Table 3.2 reflect the following considerations:
- Number of BMPs added to the inventory: This performance measure would inform planning for funding and manpower needs for long-term inspection and maintenance of BMPs. Inclusion of BMPs in the inventory also supports other functions for the data, such as providing maintenance forces with a list of assets and supporting TMDL efforts to characterize the DOT’s contribution. While the measure is stable over time, it is most influenced by the number of new roadways or road widening construction projects which are likely to plateau over time, or may be impacted by affects outside of water quality, such as an economic downturn. However, the data collected is easily defined and is feasible to collect, store and report, as shown by state DOTs who currently do so.
- Percent of right-of-way with stormwater outfalls mapped: Although knowing the location of outfalls does not immediately benefit water quality, knowing the location is anticipated to facilitate better observation and awareness of potential impacts. Understanding the percentage of the right-of-way yet to be mapped directly informs decisions on manpower and funding needs in order to complete the remaining areas. The data can be influenced over a state DOT’s decision to map outfalls once (data becomes consistent, but value is decreased) or based on a reoccurring cycle (such as some requirements to map 20% of the outfalls annually, repeating the effort every five years). This affects both the stability and the definition of the data collection protocol, and may influence how it is collected and stored.
Step P5: Identify resource needs to support inventory performance measures
To help facilitate performance measures for BMP and outfall inventories, the following research projects should be considered:
- Develop guidelines for establishing a BMP inventory. Several state DOTs do not have a BMP inventory, or have one with inadequate metadata such as not including the geospatial location, drainage area treated or design parameters like design flow or design depth. State DOTs that do not have a comprehensive inventory could benefit from additional tools to support development of an inventory including standard geodatabase structure, data acquisition tools, and data management protocols.
- Assess the cost effectiveness of a field inventory of outfalls relative to water quality benefits and provide to USEPA. In absence of the need for water quality assessments or monitoring such as those that might be required in a TMDL, the effort to perform an outfall inventory may be excessive without tangible improvements to water quality.
What can state DOTs do now to get started?
Prior to implementing BMP inventory performance measures, a state DOT may need to develop some or all of the following tools:
- BMP inventory management system, which could range from a simple spreadsheet to a stand-alone application. This would require the state DOT to identify the types of metadata to support other aspects of the stormwater program.
- Standardized classification of BMP types, so that BMPs are consistently identified using the same nomenclature, ideally based on standard rules. Design and inspection staff would then need to be trained on these rules to identify BMPs using the same nomenclature.
- Outfall definition (Classification of discharge type); some state DOTs may not distinguish the regulatory definitions of an outfall (draining to the waters of the United States) from a discharge point (where drainage leaves the DOT’s right-of-way) and may be exerting unnecessary efforts. Training to identify these different discharge types would also be necessary.
Back to top
3.3 Post-construction BMP Implementation
State DOTs have historically implemented post-construction BMPs to control water quantity. Most state DOTs are also required by their MS4 NPDES permit to control and treat stormwater runoff from development and redevelopment with post-construction BMPs. Post-construction BMPs can be structural or non-structural, targeted to treat specific parameters of concern, and reduce or minimize runoff volume.
State DOTs implement BMPs on highway projects to the maximum extent practicable, a term from the Clean Water Act and used in most state DOT permits. The term is generally interpreted to imply that state DOTs are allowed to consider right-of-way availability, site-specific conditions such as hydrology and soils, receiving stream quality, and cost in determining the feasibility of implementing BMPs to meet water quality considerations. However, there is great variation on how this evaluation is applied.
Since the requirements to implement BMPs are location-specific (dependent on regulations, impairment or classification of the receiving water, and project needs), establishing performance measures on specific design or selection components is not practicable as they would not apply nationwide. However, a potential performance measure regarding data collection and tracking is discussed below.
Step P1: Determine the BMP implementation state of the practice
Each state DOT takes a unique approach to post-construction BMP selection. Some states have extensive guidance on selection and associated tools, while others rely on engineering judgment of BMP designers, often supplemented with resources from third parties. Some state DOTs develop their own BMP manuals or design standards, while others defer to a manual issued by the state environmental resource agency, which may not have been developed in consideration of the linear highway environment.
When state-mandated design criteria cannot be met, some state DOTs are only required to document that a feasibility assessment was performed, while others are required to provide the justification to the state environmental resource agency, request a waiver, or even implement a compensatory mitigation project such as achieving greater pollutant or stormwater volume reductions on a different project or participating in a banking system (see Section 3.9 for a greater discussion of compensatory mitigation).
The advantage to developing comprehensive design guidance is consistency and the ability to communicate how BMPs were determined to be feasible or infeasible. The risk with this approach is the lack of flexibility and the need to ensure adequate training. The lack of flexibility generally limits implementation of new, innovative BMPs. With respect to training, at least one state DOT was cited in an NOV for their inability to train field staff on the nuances of the DOT’s comprehensive BMP manual.
Step P2: Identify best practices in BMP implementation
Given the variety of drivers and approaches to implementing BMP, best practices are especially subjective, as what is relevant to one state DOT’s approach is not relevant to another. The following example practices appear to support data management and use in decision-making with respect to implementing post-construction BMPs:
BMP Selection Tool
Oregon DOT has developed a BMP Selection Tool to aid designers in the selection of post-construction BMPs. The selection process encourages documentation of the BMP feasibility assessment and a formal scoring system to evaluate alternatives. It also encourages the use of “preferred BMPs” which emphasize volume reduction or greater treatment efficiency. The tool emphasizes the use of primary treatment mechanisms rather than removal efficiency data. If a BMP uses a treatment mechanism, the BMP is considered to be effective at treating the parameter of concern.
- State DOTs have developed standard forms to document requirements, site information, design goals, and feasibility-related decisions. This allows the DOTs to have clear communication with the environmental resource agencies and other stakeholders. They also compile data to support a variety of initiatives. See also inset on documentation approaches adopted by multiple state DOTs.
- State DOTs have developed explicit guidance on BMP selection, including BMP selection tools (see inset on Oregon DOT’s example). This allows the agencies to advice design staff on current suitability of various BMP types based on parameters of concern, site suitability, physical constraints, maintenance needs and constraints, and costs. These tools document decisions and can streamline regulatory agency stormwater permitting.
Step P3: Identify existing resources for BMP implementation
One of the challenges state DOTs face is validating the performance of emerging BMPs. Washington State Department of Ecology (WSDE) administers a Technology Assessment Protocol – Ecology (TAPE) program, which features a Board of External Reviewers to review emerging treatment technology design and performance data. The TAPE requires a formal review of the project quality assurance project plan (QAPP), following which practitioners conduct stormwater monitoring and prepare a technical report. WSDE evaluates reviews to assign use level designations from a tiered list. BMPs are rated with one of three designations:
- Pilot use if laboratory data exists indicating that treatment may meet performance goals. BMPs with a pilot use designation may be applied at up to five installations.
- Conditional use if laboratory and field data indicate performance goals can be met, allowable in up to 10 installations.
- General use designation if the BMPs have been validated.
Documenting key information during design process
Massachusetts DOT and Maryland SHA document design considerations and decisions using standard data collection forms (such as the one shown in Figure 3.3) which document project information including site characteristics and location, contributing impervious area, and non-structural BMPs that will be implemented on site. If applicable, the forms list the impairments and total maximum daily loads (TMDLs) for receiving stream so that water quality issues are highlighted in the design process. The forms are used to document specific BMPs that will treat runoff, and can be used to support updates to the BMP inventory, provide information for inspection and maintenance of BMPs and support TMDL compliance initiatives such as estimating load reductions or impervious cover.
Figure 3.3 Excerpt of Massachusetts DOT’s Water Quality Data Form
Source: Massachusetts DOT.
One state DOT interviewed indicated they require proprietary BMPs to be reviewed by TAPE before use. No existing resources to track or evaluate data regarding BMP implementation on a nationwide basis were identified.
Step P4: Identify and assess if BMP implementation performance measures are applicable and feasible
To assess the viability of a BMP implementation performance measure, the project team chose the following metric for evaluation:
- Number of post-construction BMPs constructed annually: At least one state (Washington State DOT) uses this metric as a performance measure. This measure is very similar to the number of BMPs added to the BMP inventory discussed in Section 3.2. It has some merit as a separate performance measure since BMP construction may be managed by a different business unit within a state DOT, but may be difficult to track separately from the proposed performance measure for the BMP inventory.
Table 3.3 evaluates the effectiveness of these performance measures using the assessment factors described in Section 2.
Table 3.3 Assessment of BMP implementation performance measures
| Assessment Factor |
# of Post-Construction BMP Constructed Annually |
| Improvements in the measure are expected to improve water quality |
3
|
| The measure can be used to inform policy making and determine manpower and funding needs |
2
|
| The measure is flexible enough to allow changes over time as technology and regulations change, with little change to the meaning of historical data |
5
|
| The data that needs to be collected to support the measure is defined |
5
|
| It is feasible and practical to collect, store, and report data |
4
|
| The data is or can be collected within existing programs |
4
|
| Total Score |
23
|
| Note: 5 is the highest ranking and 1 is the lowest ranking. |
The scores in Table 3.3 reflect the following considerations:
- Number of post-construction BMPs constructed annually: Since BMPs are constructed to mitigate impacts to water quality and quantity, the number of BMPs implemented should directly influence resulting water quality assuming the BMPs are designed and installed correctly. This performance measure would inform planning for funding and manpower needs for long-term inspection and maintenance of BMPs. While the measure is stable over time, it is most influenced by the number of new roadways or road widening construction projects which are likely to plateau over time, or may be impacted by affects outside of water quality, such as an economic downturn. However, the data to be collected is easily defined and is feasible to collect, store and report, as shown by state DOTs who currently do so.
Step P5: Identify resource needs to support BMP implementation performance measures
To help facilitate performance measures for BMP implementation, the following research projects should be considered:
- Develop a repository of state DOT monitoring data using the FHWA Highway Runoff Database.No consistent BMP performance data exists, in part due to geographical variability and lack of centralized data storage. Some resources like the International BMP database are useful, but also contain parcel-based data which could be substantially different from data associated with linear facilities. The FHWA Highway Runoff Database does not currently have centralized data storage so that a state DOT can access performance data from comparable state DOTs. This would also support designers during BMP design, independent of performance measurement.
- Develop guidance on the applicability of the “maximum extent practicable” and the “infeasibility” to linear systems, including evaluations of how to consider cost and constructability when selecting BMPs.
What can state DOTs do now to get started?
Prior to implementing the performance measure for the number of BMPs constructed annually, a state DOT may need to develop some or all of the following tools:
- BMP inventory, which could range from a simple spreadsheet to a stand-alone application.
- Standardized classification of BMP types, so that BMPs are consistently identified using the same nomenclature, ideally based on standard rules. Design and inspection staff would then need to be trained on these rules to identify BMPs using the same nomenclature.
- Performance efficiency for each BMP relative to parameters of concern. This could be numeric (based on effluent concentration or percent removal) or qualitative (high, medium, or low).
- Identify preferred BMPs, which could be selected based on BMP performance, cost, maintenance needs, or other agency-specific concerns. In some cases where environmental resource agencies have approved of this preferred BMP list, permitting for planning and construction projects has been streamlined.
- Standardized data collection forms to compile the information needed for every design project (such as location, environmental concerns, and mitigation actions).
Back to top
3.4 Employee and Contractor Training
Training is a key element of a successful stormwater program, making it an acceptable topic for a potential performance measure. For years, state DOTs have implemented stormwater-related training, most notably to address hydrology, roadside maintenance, and potential stormwater runoff from construction sites. Such training may have been implemented as a means to protect a DOT’s assets and facilitate the state DOT’s role to provide adequate transportation, while still providing tangential knowledge to protect water quality. Additionally, many MS4 NPDES permits require state DOT staff have specific training on stormwater quality issues, including erosion and sediment control, illicit discharge detection and elimination, pollution prevention, and in some cases, post-construction stormwater BMP design and maintenance.
Some training requirements are applied through the MS4 NPDES program nationally, such as the requirement for annual pollution prevention training for industrial facilities, including maintenance yards. Most requirements are difficult to standardize, due in part to the following:
- Training requirements are state specific: Staff should be educated on state-specific regulations, and some state environmental resource agencies may require training in unique topics, such as a focus on nutrient management in the Chesapeake Bay drainage area.
- Training requirements are technology specific: Learning to develop application rates for products such as polyacrylamide, or to design structural construction BMPs to treat clayey soils may require advanced training.
- Training requirements are project specific: USEPA’s Construction General Permit and other state-specific construction permits generally require construction staff be trained on the content and management requirements of the Stormwater Pollution Prevention Plan (SWPPP) for each specific site.
- Training requirements are role specific: The amount, detail and complexity of training for any topic should be tailored to the employee’s role within the organization and relative to potential impact on water quality.
Therefore, although training is a common and important activity for most state DOTs, potential performance measures are more applicable to assessing the training programs developed by state DOTs instead of the specific content of the training materials.
Step P1: Determine the training state of the practice
The USEPA ICR dataset indicates that many state DOTs provide training to staff and contractors. While 41 state DOTs provide training on construction stormwater issues, only 25 state DOTs provide training on post-construction stormwater issues to staff. Only 12 of those state DOTs also provide post-construction stormwater training to contractors.
Among state DOTs that provide broader stormwater training, the topics including the following:
- Erosion and sediment control;
- Illicit discharge detection and elimination;
- Pollution prevention at maintenance yards, rest areas, park and rides, rail and ferry stations, and construction sites;
- Design, maintenance and inspection of structural and non-structural BMPs to reduce volume and treat runoff; and
- Specific training on the state-specific stormwater regulation and DOT-specific practices and policies.
Failure to document training has been an issue for several DOTs, and has resulted in NOVs issued by the state environmental resource agencies. State DOTs that track training use various methods. The most frequent tracking method is maintaining sign-in sheet records as hard copies at the location where the training is provided. Some DOTs track training electronically, while other state DOTs have experienced challenges in starting learning management systems due to limited information technology resources. Even at state DOTs that track training, not all training with an impact on water quality may be captured. For example, when a water quality specialist from the headquarters office visits a state DOT facility and provides “on-the-job” training to staff at the District or Division-level, this activity may not be captured, even though it is an important element of permit compliance and can have a material impact on water quality outcomes.
Step P2: Identify best practices in training
Continuously improve training by incorporating lessons learned
Missouri DOT has a simple but effective practice relative to training. The agency has developed a protocol so that staff who inspect construction sites document common issues in a running list. The list is then used to review needs and customize content for annual training.
Several state DOTs have developed high-quality training materials for assisting staff in various roles to determine appropriate work practices relative to stormwater. The following practices have been successfully applied at some state DOTs and have potential to benefit the broader transportation stormwater community:
- Some DOTs maintain a list of different staff roles and related training needs based on the position description (see inset on Arizona DOT).
- Stormwater training can be rolled into non-stormwater annual training for maintenance staff.
- Successful state DOTs use information from other program areas to identify training needs (see inset on Missouri DOT, for example).
- Several state DOTs have found the need to develop quick guides for efficient dissemination of information. For example, while developing a stormwater BMP manual, it is tempting to provide the most comprehensive document feasible. However, manuals that are too long and complex may become a compliance risk when audited by environmental resources agencies if staff from the state DOT has not been adequately trained on the details in the manual. Some agencies have developed 10-15 page quick field manuals to briefly summarize the information content.
- Several state DOTs, such as Florida and North Carolina DOTs, have collaborated with local universities to develop training programs for construction and post construction BMP design, implementation and inspection. The training is often also available to contractors.
Staff training matrix used to target training to job responsibilities
Arizona DOT requires all new employees and existing staff whose job duties change to include responsibilities that have an impact on water quality to receive appropriate training within the first year of their hire date or the date of their change in responsibilities. Employees identified for training are required to take general stormwater awareness training. Five additional training segments are offered on a variety of stormwater topics. Arizona DOT maintains a training matrix to identify which of the six courses is required based on job function, as shown in Figure 3.4.
Figure 3.4 Staff training matrix used by Arizona DOT
Source: Arizona DOT.
Step P3: Identify existing resources for stormwater training
The National Highway Institute (NHI) was established by Congress in 1970 and is the training and education arm of the FHWA. NHI offers courses in multiple program areas including construction and maintenance, environment, and hydraulics. These courses can be hosted by any organization including contractors, private businesses, and transportation-associated organizations.
No existing resources or tools to track stormwater training data (thus supporting the proposed performance measures) on a national basis were identified.
Step P4: Identify and evaluate if stormwater training performance measures are applicable and feasible
To assess the viability of training performance measures, the project team chose the following metrics for evaluation:
- Percent of staff receiving required stormwater training: This is a performance measure that is frequently tracked by state DOTs and reported in annual reports to state environmental resource agencies. It is a good indicator if the training program is reaching all of the expected trainees. This could be broken into submeasures that roll up for the appropriate percentages for construction, BMP design, inspection and maintenance, and pollution prevention related training.
- Number of hours per year of training per staff in a stormwater role: This performance measure can evaluate the commitments to training for staff as well as indicate the commitment of the DOT to stormwater.
- Percent of the training program audited by the state DOT within the past two years: The measure would track an audit program designed by the state DOT to evaluate effectiveness of training. As in the case of the inspection and maintenance program in Section 3.1, the scope of the training audit program can be flexibly defined by state DOTs.
The three performance measures above may provide summary data for a training program. When establishing targets and tracking the data, state DOTs may find it helpful to track these measures separately for individual staff roles since some staff may require more training than others.
Examples of staff that might be tracked as individual groups include:
- Construction designers, inspectors, and installation crews;
- Post-construction BMP designers, inspectors and installation crews;
- SWPPP teams and general staff on maintenance yards;
- Managers overseeing projects with a potential to impact stormwater; and
- Staff involved in new location corridor selection, seeking to avoid or minimize water quality impacts.
Table 3.4 evaluates the effectiveness of these performance measures using the assessment factors described in Section 2.
Table 3.4 Assessment of stormwater training performance measures
| Assessment Factor |
% of staff receiving required stormwater training |
# of hours per year of training per staff in a stormwater role |
% of the training program audited by state DOT within the past two years |
|
Improvements in the measure are expected to improve water quality
|
4
|
2
|
2
|
|
The measure can be used to inform policy making and determine manpower and funding needs
|
4
|
4
|
4
|
|
The measure is flexible enough to allow changes over time as technology and regulations change, with little change to the meaning of historical data
|
4
|
2
|
2
|
|
The data that needs to be collected to support the measure is defined
|
3
|
4
|
3
|
|
It is feasible and practical to collect, store, and report data
|
3
|
2
|
3
|
|
The data is or can be collected within existing programs
|
2
|
1
|
2
|
|
Total Score
|
20
|
15
|
16
|
| Note: 5 is the highest ranking and 1 is the lowest ranking. |
The scores in Table 3.4 reflect the following considerations:
- Percent of staff receiving required stormwater training: This measure involves staff requiring training to be identified and a training tracking mechanism to be implemented. USEPA appears to favor the use of employee training and it can result in improved water quality by increasing the employee’s understanding of the potential impacts their activities can have. Several state DOTs have systems in place to compile this information. However, the measure would require tracking a large amount of data that change as personnel and their roles change.
- Number of hours per year of training per staff in a stormwater role: This measure also requires staff who need training to be identified and a training tracking mechanism to be implemented. Tracking the amount of time an individual spends in training annually would likely require developing a specific timesheet code for this activity. Alternatively, each DOT could estimate the number of hours a specific staff role is expected to participate in training. As with the measure above, no amount of training will improve water quality if it is not effective and well received by the staff.
- Percent of the training program audited by the state DOT within the past two years: An audit program would improve the effectiveness of the training program. However, it is unclear that any state DOTs have a robust training audit program. In non-DOT organizations, auditing training effectiveness and information retention is often performed through surveys or interviews, sometimes occurring weeks or months after the training has taken place. The two year audit period can be changed to another span of time.
Step P5: Identify resource needs to support training performance measures
To help facilitate performance measures for stormwater training, the following research projects should be considered:
- Establish a repository of transportation-related training courses for basic awareness of stormwater quality. A significant amount of training must be customized to address state- or location-specific requirements, technology, and role-specific requirements. However, introductory information such as general water quality impacts and nationwide regulatory concerns such as recordkeeping could be presented for by employees new to the stormwater field. Providing such training on a national website would make it readily available.
- Develop guidance to assess the effectiveness of training. Tracking what training is completed alone does not mean that the training is effective. Effective training occurs when staff implement the concepts during the normal course of their work. A protocol to seek and collect input from staff to determine if the training was useful in their work roles, how long the information was retained, and if the delivery of the information was appropriate, can improve the effectiveness of subsequent training and increase the benefits to water quality.
- Develop guidance to establish a training matrix by employee role. In order to result in positive environmental effects as well as be cost and manpower efficient, training should be comparable to the stormwater-related role a staff member holds.
What can state DOTs do now to get started?
Prior to implementing the performance measure for training a state DOT may need to develop some or all of the following tools:
- Minimum training requirements for all staff.
- Organization of training needs by roles. The effort should include personnel who may not recognize their role in supporting water quality.
- Appropriate information technology resources, such as a learning management system and training delivery (e.g., webinars).
- Centralized list of training by employee, if the agency does not have a formalized learning management system. Even if the agency has a learning management system, it is important to track on-the-job and other informal training.
- Audit protocol to evaluate training program effectiveness.
Back to top
3.5 Erosion and Sediment Control
Erosion and sediment control is a common practice for state DOTs, reflective of their mission to construct transportation services. Stormwater discharges from construction activities such as clearing, grading, excavating, and stockpiling are typically required to install, maintain, and inspect construction BMPs and pollution prevention activities to reduce pollutants in runoff from construction sites. Projects that disturb one or more acres are regulated under the NPDES program. Additionally, some state regulatory agencies may have thresholds below one acre, especially in sensitive environments such as coastal counties or areas draining to impaired waters.
Construction BMPs and pollution prevention activities are selected after consideration of site-specific conditions such as soil infiltration capabilities, soil types, slopes, types of construction activities and local regulatory requirements. Therefore, establishing a potential performance measure on the types of BMPs or pollution prevention activities selected is not feasible due to the necessary variation in their implementation.
Under the NPDES program, state DOTs are required to develop a SWPPP for most construction sites where stormwater discharges may reach waters of the United States. (Some states use different terminology and may also have slightly different requirements, but the overall goals are similar.) Since this is a widely applied and consistent requirement, performance measures related to the SWPPP are potential candidates for application nationwide. A copy of the SWPPP is required to be stored on-site, and needs to include the following:
- Detailed project description, including a site map, construction site details (in phases if applicable), and receiving waters;
- Description of structural and non-structural BMPs and stabilization practices that will be used on the project; and
- Description of a program to inspect and maintain BMPs and to evaluate their effectiveness.
The technical aspects of the construction stormwater rules vary across the country, but the SWPPP requirements are generally consistent. State DOTs have been found to be in non-compliance due to inadequate implementation of SWPPPs. Hence the implementation of SWPPs is an appropriate consideration for performance measurement. Similarly, the broad requirements for inspection are well defined, and hence also a possible performance measure.
Step P1: Determine the erosion and sediment control state of the practice
State DOTs may be authorized to discharge stormwater associated with construction activities under a programmatic MS4 permit, or under stand-alone NPDES permits for each construction project. SWPPP requirements are often outlined in the permit(s), which include inspector certification requirements, inspection frequency, and reporting obligations. At most state DOTs, their construction stormwater program is the most well-developed aspect of their overall stormwater program. Most state DOTs have been subject to these requirements for several years. This is confirmed by the USEPA ICR dataset, which shows that 44 state DOTs indicated they had an erosion and sediment control program. Several state DOTs have developed guidance documents to assist design engineers in the development of these SWPPPs for applicable construction projects.
When the USEPA had promulgated the Effluent Limitation Guidelines and Standards for the Construction and Development Point Source Category, it was considering imposing a numeric limit on construction stormwater runoff. However, the agency subsequently decided to exclude numerical limits. In the interim though, some states like Washington implemented regulations with numeric limitations on turbidity in construction stormwater discharges. Other states like Oregon set limits on how much turbidity in streams can increase over background concentrations.
Review of the USEPA ICR dataset indicates that 45 state DOTs responding maintain a list of active construction projects. It is unclear in what format these lists are maintained, or if the list includes other information such as if a SWPPP was completed or inspection status.
Step P2: Identify best practices in erosion and sediment control
Some of the best practices in performance measurement for erosion and sediment control include the following:
- The majority of state DOTs already maintain a list of active construction projects.
- Some state DOTs track SWPPP development and implementation centrally for active construction projects, which allows aggregation and use as a performance measure.
- Some state DOTs have implemented an internal audit program and use performance measures to gauge the effectiveness of various erosion and sediment control program elements. See the example of Caltrans’ audit program in the inset.
Step P3: Identify existing resources for erosion and sediment control
No existing resources or tools to track SWPPP data on a national basis were identified. The project team did find the American Association of State Highway and Transportation Officials (AASHTO) National Transportation Product Evaluation Program (NTPEP) to be a useful resource for selection of erosion and control BMPs.
Step P4: Identify and evaluate if erosion and sediment control performance measures are applicable and feasible
To assess the viability of erosion and sediment control performance measures, the project team chose the following three different metrics for evaluation:
- Percent of projects requiring construction SWPPPs with one in place: This is an existing performance measure used by some state DOTs, and refers to the percentage of projects which require a SWPPP that actually have one in place.
- Percent required inspections completed: Unlike maintenance inspections, the inspection requirements for erosion and sediment control are specified in the regulations. This proposed performance measure assesses what percentage of required inspections were actually performed.
- Percent of construction sites audited by state DOT in two years with “satisfactory” rating: Having an audit program confirms consistency of the inspections and strengthens the inspection program. A two-year rolling metric is recommended to help moderate variability in programs from year to year. The specifics of the audit rating system, including what constitutes “satisfactory” would be defined by each individual state DOT.
Self-auditing construction stormwater performance
Caltrans has implemented a formal self-auditing program. Caltrans has an extensive tracking program involving detailed information like the percentage of pre-construction meetings attended by a District Construction Stormwater Coordinator (DCSWC) or a representative from the Regional Water Quality Control Board. The Construction Compliance Evaluation Plan (CCEP) is the DCSWC’s evaluation of a contractor’s SWPPP or Water Pollution Control Plan (WPCP) implementation. The CCEP features a numeric scale of 1-4 for water quality compliance, with 4 representing non-compliance, and an alphanumeric scale of A-D for contract administrative activities, with D indicating non-compliance. For example, a combined rating of 1A indicates that the construction project implemented construction BMPs in accordance with the project’s SWPPP or WPCP (1 rating), and that there are no project document deficiencies (A rating). Figure 3.5 presents the trend in ratings over time.
Figure 3.5 Excerpt from Caltrans Annual Report
Source: Caltrans (2013).
Note: Figure displays trend in self-audit ratings for construction projects.
Table 3.5 evaluates the effectiveness of these performance measures using the assessment factors described in Section 2.
Table 3.5 Assessment of erosion and sediment control performance measures
| Assessment Factor |
% projects requiring construction SWPPPs with one in place |
% required E&SC inspections completed |
% construction sites audited by state DOT in 2 Years with "satisfactory" rating |
|
Improvements in the measure are expected to improve water quality
|
3
|
3
|
4
|
|
The measure can be used to inform policy making and determine manpower and funding needs
|
4
|
4
|
3
|
|
The measure is flexible enough to allow changes over time as technology and regulations change, with little change to the meaning of historical data
|
4
|
4
|
4
|
|
The data that needs to be collected to support the measure is defined
|
3
|
5
|
4
|
|
It is feasible and practical to collect, store, and report data
|
5
|
2
|
4
|
|
The data is or can be collected within existing programs
|
5
|
3
|
3
|
|
Total Score
|
24
|
21
|
22
|
| Note: 5 is the highest ranking and 1 is the lowest ranking. |
Relative to other topics, there is greater consistency in construction stormwater programs across state DOTs due to the history of these rules. The scores in Table 3.5 reflect the following considerations:
- Percent of projects requiring construction SWPPPs with one in place: Since the rules governing SWPPP requirements are similar across the country, and since most state DOTs maintain a list of active construction projects, this could be implemented by state DOTs without requiring the development of major new resources or work practices. This measure scores moderately on its impact on water quality because the existence of a SWPPP does not always mean it is well implemented or effective. There may be some sensitivity to this measure because of the perception of self-reporting violations (for a discussion of this issue, see Section 2.3).
- Percent required inspections completed: This measure has a greater bearing on water quality than the first measure since it directly observes performance of a SWPPP or BMPs; however, it is more difficult to aggregate this data from numerous inspectors. It would require the state DOT to implement a centralized tracking system. Inspectors could either directly add information to the system (perhaps using mobile devices) or there could be a data solicitation process periodically (e.g., quarterly) for this information. There is also sensitivity because of the perception of self-reporting violations (for a discussion of this issue, see Section 2.3).
- Percent construction sites audited by state DOT in two years with “satisfactory” rating: If a state DOT has an internal compliance verification program, then this measure can be expected to improve implementation of erosion and sediment control BMPs and result in an improvement in the quality of runoff from state DOT construction projects. Several state DOTs currently have an auditing program.
Step P5: Identify resource needs to support erosion and sediment control performance measures
To help facilitate performance measures for erosion and sediment control, the following projects should be considered:
- Develop DOT-specific guidance on the development and maintenance of construction SWPPPs, including BMP selection guidance, documentation, and recordkeeping.
-
- Develop guidance on quick reference guides and basic training on erosion and sediment control. While several states have developed erosion and sediment control training, inadequate or improper implementation and maintenance of BMPs remains a leading cause of NOVs. Training on basic information could be developed and hosted on a public website to facilitate training.
What can state DOTs do now to get started?
Prior to implementing an erosion and sediment control performance measures a state DOT may need to develop some or all of the following tools:
- Centralized list of active construction projects and status of SWPPPs;
- Training for inspectors on the construction stormwater requirements;
- Centralized database on inspections, including periodic inspections and inspections after qualifying rainfall events; and
- Internal audit process, including protocols and a standard audit frequency.
Back to top
3.6 Stormwater Management at Maintenance Yards, Depots, and Shops
State DOTs may operate several types of non-linear facilities that are considered by USEPA to have the potential to impact water quality. These are sometimes referred to by USEPA as “industrial facilities” because the permitted activities are similar to activities at non-DOT industrial businesses. Activities at state DOTs often considered “industrial” include:
- Vehicle maintenance, including maintenance or repair of rail, ferry, aircraft, or construction equipment;
- Salt or brine storage areas and vehicles associated with its application; and
- Storage of materials associated with roadway construction or repairs, such as asphalt, oils fuels, pesticides, herbicides, sand, and gravel.
Common potential pollutant sources identified at these “industrial” facilities operated by state DOTs include sediment, contaminated groundwater, deicing chemicals, solvents, oils, paints, coolants, and metals.
The regulatory requirements for BMPs at these facilities have been in place for decades. Stormwater discharges from industrial activities have been regulated under the NPDES program since 1990. The program requires that an SWPPP be prepared for each facility to document potential sources of impacts to stormwater. The SWPPP must include structural and non-structural BMPs that will be implemented to reduce these impacts and discuss how staff will be trained to minimize impacts to stormwater quality. Some state DOTs are also required to implement SWPPPs for park and ride lots, while others are not.
Additionally, facilities that store oil in quantities over 1,320 gallons total are subject to the Oil Pollution regulations (40 CFR 112) which originated in 1973 and has subsequently been refined in the 1990s and 2000s. These facilities must implement Spill Pollution, Control and Countermeasure (SPCC) plans that document the storage of oil and oil-like materials, and the structural and non-structural BMPs used to reduce the potential for spills.
Step P1: Determine the state of the practice for stormwater management at maintenance yards, depots and shops
The NPDES program and the SPCC regulations have established standardized requirements but do allow for site-specific assessments to identify the best structural and non-structural BMPs to reduce stormwater pollution at each individual location. While this flexibility is needed by state DOTs, it also makes industrial facilities a relatively easy target for notices of violation (NOV) from regulators. Indeed, this area has been identified as one of the top causes of NOVs for state DOTs during the literature review. Audits performed by USEPA and state regulators at state DOT facilities have found the following common issues:
- BMPs not documented, maintained or adequate to address potential for stormwater impacts;
- Failure to review and update SWPPPs and SPCCs;
- Inadequate staff training or documentation to show that relevant staff received training; and
- Inadequate documentation of inspections and training.
According to the USEPA ICR data, 24 state DOTs perform inspections of industrial stormwater activities within their MS4 jurisdictions and 12 of these agencies also conduct inspections in areas outside of their MS4 jurisdiction. Another 24 state DOTs report having no industrial components. Table 3.6 summarizes the specific components respondents track.
Table 3.6 Industrial components tracked within transportation-related stormwater programs as reported in USEPA’s ICR database
| Component |
# of state DOTs tracking from 2005 - 2009 |
Inventory of industrial facilities (i.e. a list of the facilities themselves) |
17 |
Education of industrial operators about stormwater requirements or controls |
13 |
Site inspection of industrial facilities for stormwater |
18 |
Site inspection of commercial facilities for stormwater |
4 |
Training of inspectors |
13 |
None, there is no industrial component in the MS4 stormwater program |
24 |
| Source: USEPA ICR. |
As can be seen from Table 3.6, the majority of the state DOTs that have an industrial component to their MS4 program maintain a list of industrial facilities and conduct inspections of these facilities.
Step P2: Identify best practices for stormwater management at maintenance yards, depots, and shops
There were a variety of successful practices state DOTs have adopted to measure performance with respect to stormwater management at industrial facilities.
- Some state DOTs track SWPPP implementation and report it on their centralized performance measurement reports (see inset on Washington State DOT).
- Missouri DOT maintains tiered dashboards that measure performance at several levels of the organization for a variety of concerns at industrial facilities (see inset on compliance dashboards).
- Several state DOTs have developed standardized templates for their SWPPPs and SPCC plans.
- North Carolina DOT tracks completion of the SWPPP requirements using a centralized dashboard.
- Multiple state DOTs have implemented or are implementing environmental management systems to help manage commitments at industrial facilities. This usually includes formal audits at a subset of facilities so that every facility is audited every few years.
Tracking SWPPP Implementation
Washington State DOT tracks its SWPPP implementation and reports its progress as part of its performancereports called the Gray Notebook (WSDOT, 2012). Table 3.7 shows data from 2009 to 2012 reported by WSDOT.
Table 3.7 Excerpt from WSDOT’s Gray Notebook showing trend in SWPPP implementation
| Performance Measure |
2009 |
2010 |
2011 |
2012 |
Progress toward developing and implementing SWPPPs – Percent of maintenance facilities, rest areas, and park & ride lots inspected twice annually for SWPPP implementation |
100% |
100% |
100% |
90% |
| Source: Adopted from WSDOT (2012); * = incomplete data for 2012 at time of publication. |
Step P3: Identify existing resources for stormwater management at maintenance yards, depots and shops
The Center for Environmental Excellence by AASHTO maintains a repository of stormwater-related guidance documents and research but few are relevant to industrial facilities. USEPA has several guidance documents to develop and implement SWPPPs and SPCCs, but these are generic to all facility types and do not focus on the needs of state DOTs. The project team did not find any free resources that would support performance measurement for industrial activities although there are commercial products including environmental management systems that can help state DOTs manage their commitments at maintenance yards, depots and shops.
Compliance Dashboards
Missouri DOT has implemented a performance measures program at maintenance facilities. The agency inspects and reports on six focus areas related directly to SWPPPs and SPCCs. The percentage of facilities in compliance with each of the six focus areas are reported in a District Tracker, an excerpt of which is shown as Figure 3.6.
Figure 3.6 Example of tracking percent compliance by area of concern
Source: Missouri DOT (2014).
Step P4: Identify and evaluate if performance measures are applicable and feasible for stormwater management at maintenance yards, depots and shops
The following metrics were used to assess the viability of an inventory performance measure:
- Percent of facilities with SWPPPs/SPCCs completed: This is a measure that a few state DOTs currently measure, and the requirements for SWPPPs are fairly consistent across states. Only facilities which require SWPPPs and/or SPCCs would be included in the data.
- Percent of facilities receiving “satisfactory” ratings during audits: Having an audit program confirms consistency of the inspections and strengthens the inspection program.
Table 3.8 evaluates the effectiveness of these performance measures using the assessment factors described in Section 2.
Table 3.8 Assessment of watershed planning performance measures
| Assessment Factor |
% facilities with SWPPPs and/or SPCCs completed |
% facilities receiving “satisfactory” rating during audits |
Improvements in the measure are expected to improve water quality |
3 |
4 |
The measure can be used to inform policy making and determine manpower and funding needs |
4 |
3 |
The measure is flexible enough to allow changes over time as technology and regulations change, with little change to the meaning of historical data |
4 |
4 |
The data that needs to be collected to support the measure is defined |
4 |
4 |
It is feasible and practical to collect, store, and report data |
4 |
3 |
The data is or can be collected within existing programs |
4 |
3 |
Total Score |
23 |
21 |
| Note: 5 is the highest ranking and 1 is the lowest ranking. |
The scores in Table 3.8 reflect the following considerations:
- Percent of facilities with SWPPPs/SPCCs completed: As discussed previously, several state DOTs already maintain a list of industrial facilities that would require a SWPPP and the requirements are well-defined, so this performance measure is relatively simple to implement. The limitation with this measure is that implementing a SWPPP does not mean the BMPs were actually implemented and effective; therefore, its actual effect on water quality ranks moderately.
- Percent of facilities receiving “satisfactory” ratings during audits: Fewer state DOTs have an audit program, but for state DOTs that implement this type of program, this performance measure can be of greater value since it actually reflects the effectiveness of the program.
Step P5: Identify resource needs to support performance measures for stormwater management at maintenance yards, depots and shops
To help facilitate performance measures for maintenance yards, depots and shops, the following research projects should be considered:
- Develop DOT-specific guidance on the development and maintenance of SWPPPs and SPCC plans, including BMP selection guidance, documentation, and recordkeeping. This tool could be helpful to reduce the number of NOVs state DOTs receive due to SWPPPs.
- Develop guidance for appropriate secondary containment for products generally found at state DOT maintenance yards. Many state DOTs do not have the training to select coatings for secondary containment structures that will not react to some products, nor how to perform detailed inspections to verify the containment is sound. General guidance with instructions on how to assess unusual products would be helpful.
- Develop quick reference guides and basic training on general pollution prevention needs. Many controls for pollution prevention are common nationwide. Training on basic information could be developed and hosted on a public website to facilitate training.
- Develop guidance for minimizing impacts from brine and salt management. Many state DOTs do not yet know that brine tanks require secondary containment. Additionally, salt spills at maintenance yards may not be cleaned up in a timely fashion.
What can state DOTs do now to get started?
Prior to implementing performance measures for stormwater management at maintenance yards, depots and shops a state DOT may need to develop some or all of the following tools or data sources:
- Inventory of facilities and associated activities and materials.
- Mechanism to track results such as completion of SWPPPs and SPCCs and completed inspections and audits.
- Training on requirements for SWPPPs and SPCCs for facility personnel and inspectors. This is especially required for elements that staff might not be aware, e.g., that brine tanks should be included in SWPPPs.
- Audit protocol, including classification of facility compliance status.
Back to top
3.7 Non-Structural BMPs
Nonstructural BMPs are stormwater controls designed to achieve source control. Some examples of nonstructural BMPs applicable to the highway environment include street sweeping, public outreach and education, litter control, and management of fertilizer application within the right-of-way. Most state DOTs also use employee/contractor training programs, minimal application rates for deicers or herbicides, pet waste collection, stream buffers, recycling programs, vehicle maintenance programs, dust control, and good housekeeping programs.
The application of non-structural BMPs varies based on various environmental, social, and regulatory drivers. While several of these non-structural BMPs have tremendous value in improving water quality, many are not significant enough individually or consistent enough nationwide to support performance measurement. For this reason, the discussion in this section is focused on deicer use, fertilizer/herbicide use, and street sweeping.
Step P1: Determine the state of the practice for implementation of non-structural BMPs
The level of tracking of non-structural BMP implementation varies substantially. State DOTs commonly report on some non-structural BMPs in annual reports to the state environmental resource agencies, including the following:
- Street sweeping: This was one of the topics that received the most attention when NPDES MS4 permits were first issued. 39 state DOTs indicated in the USEPA ICR that this is a component of their stormwater program, although how many agencies track the total lane-miles swept is unknown. Street sweeping in the highway environment is typically less frequent than the municipal environment, so caution should be used in over-emphasizing its use.
- Tons of deicer applied to DOT-owned rights-of-way: Several state DOTs have developed extensive protocols to manage the amount of deicer use, and to track annual use. There has recently been greater interest in the topic due to chloride TMDLs.
- Fertilizer use: Nutrients are the second largest source of waterbody impairments in the United States, and reducing fertilizer use is a high priority for several state DOTs.
- Herbicide and pesticide application: Reducing the application of herbicides and pesticides is an element of several NPDES permits, and state DOTs have implemented extensive procedures including appropriate licensing requirements.
- Staff training (discussed separately in Section 3.4)
Table 3.9 summarizes the number of state DOTs reporting in the USEPA ICR that they currently track quantity data related to specific non-structural BMPs.
Table 3.9 Tracking of non-structural BMPs
| Type of Non-Structural BMP Data |
Number of state DOTs Tracking |
Amount of deicing/anti-icing material used |
34 |
Amount of fertilizers used |
19 |
Amount of pesticides used |
23 |
Amount of herbicides used |
31 |
| Source: USEPA ICR. |
Step P2: Identify best practices for implementation of non-structural BMPs
Several state DOTs have implemented various best practices that support the implementation of performance measurement or otherwise support stormwater management for non-structural BMPs, including the following:
- Implement a road weather information system (RWIS) and track the amount of deicing material applied. Several states have adopted an RWIS (see inset for Massachusetts example) which allows state DOTs to adjust the application of deicing material to the weather conditions. This allows them to reduce the amount of material substantially – 70% in the case of Nevada DOT (Nevada DOT, 2012).
- Technology for automatic vehicle locating has improved, and at least one state DOT (Delaware DOT) is experimenting with implementing this technology on sweepers to help with TMDL compliance. This will improve the ability for state DOTs to track not only sweeping but also deicer application (since deicers are generally applied at a fixed rate per mile).
- While not directly related to performance measurement, the project team found good examples of how state DOTs are developing strategies to minimize impacts from fertilizer and herbicide application to receiving waters such as developing operational maps with no-spray or limited-spray areas based on evaluation of risks to adjacent water bodies.
Road Weather Information Systems and tracking salt usage
Several state DOTs have been tracking salt usage in an effort to avoid excessive deicer application. As an example, Massachusetts DOT has been utilizing a Road Weather Information System (RWIS) to help them estimate the needed frequency for salt application before and during winter storm events. The RWIS is a network of 26 permanent roadside and two mobile weather stations and associated sensor technologies that collect and transmit weather data, road condition data, and chemical concentrations of deicers to govern the frequency and timing of salt application. The system includes over 100 mobile sensors, which can read the pavement temperature (in addition to the ambient air temperature) and pavement friction. RWIS data guide deicing actions, such as when another deicing application is warranted or if a different deicer (e.g., brine) is required. Figure 3.7 presents annual salt use versus a winter severity index. This type of chart allows policy makers to validate that salt use is commensurate with need.
Figure 3.7 Massachusetts DOT salt use vs. average statewide winter severity index
Source: Massachusetts DOT (2012).
Step P3: Identify existing resources for implementation of non-structural BMPs
The project team did not identify any free existing resources that support performance measurement for non-structural BMPs that could be readily adopted by state DOTs.
Step P4: Identify and assess if performance measures are applicable and feasible for implementation of non-structural BMPs
The following metrics were identified to assess the viability of performance measures for non-structural BMPs:
- Tons deicer per lane mile by winter severity index: Some state DOTs like Massachusetts and New Hampshire already track deicer application and estimate a winter severity index. These are compared to verify if deicer use was commensurate with weather conditions. Normalizing that value to total length of highways allows state DOTs to compare better with historical trends (when the state DOT might have managed a smaller asset base) or with its peer agencies (to evaluate if there are effective practices they are adopting)
- Tons of fertilizer use per acre right-of-way: Several state DOTs already track and report on fertilizer use. Again, normalizing the measure to the total real estate asset base allows state DOTs to make comparisons across time and with peers
- Lane miles of highways swept: This measure is frequently tracked by state DOTs and reported on annual reports to the state environmental resource agency.
Table 3.10 evaluates the effectiveness of these performance measures using the assessment factors described in Section 2.
Table 3.10 Assessment of non-structural BMP performance measures
| Assessment Factor |
Tons deicer/lane mile by winter severity index |
Tons of fertilizer use/acre right-of-way |
% of lane miles swept |
Improvements in the measure are expected to improve water quality |
5 |
3 |
2 |
The measure can be used to inform policy making and determine manpower and funding needs |
3 |
3 |
4 |
The measure is flexible enough to allow changes over time as technology and regulations change, with little change to the meaning of historical data |
2 |
2 |
4 |
The data that needs to be collected to support the measure is defined |
4 |
4 |
5 |
It is feasible and practical to collect, store, and report data |
3 |
4 |
3 |
The data is or can be collected within existing programs |
4 |
3 |
2 |
Total Score |
21 |
19 |
20 |
| Note: 5 is the highest ranking and 1 is the lowest ranking. |
The scores in Table 3.10 reflect the following considerations:
- Tons deicer per lane mile by winter severity index: This measure is valuable to reducing the impact of deicer on receiving waters. However, there is some policy sensitivity with reducing deicer use, since the application of these chemicals is required for safe transportation. Not all state DOTs are sensitive to salt usage depending on climatic conditions. It is also not clear if a consistent winter severity index (or a small subset of indices) is feasible across the country.
- Tons of fertilizer use per acre right-of-way: The raw data to compile this information is already collected by several state DOTs. This measure is easy to compare, although may not be the highest priority for performance measurement at most state DOTs.
- Lane miles of highways swept: While sweeping is an important BMP for a municipality, it is less effective for state DOTs. Highways are typically not swept as often as city roads. Additionally, state DOTs may not always track sweeping, especially when conducted by municipal partners or contractors.
Step P5: Identify resource needs to support performance measures for implementation of non-structural BMPs
The following research project would support the development of non-structural BMP performance measures listed in this section:
-
Evaluate the feasibility of establishing a consistent winter severity index that can be applied across the country or a smaller selection of appropriate consistent indices that state DOTs could adopt from rather than developing their own.
What can state DOTs do now to get started?
Prior to implementing one of these non-structural BMP performance measures a state DOT may need to develop some or all of the following tools or data sources:
- Inventory of right-of-ways and roadway assets, which should be available from the state DOT’s asset management system
- Policy for application of deicers, fertilizers and other chemicals
- Winter severity index, ideally based on a consistent national protocol, but otherwise well documented and robust
Back to top
3.8 Impaired Waters and TMDLs
Section 303(d) of the Clean Water Act requires state environmental agencies to address surface waters that are impaired, i.e., that do not meet water quality standards for their designated use. A TMDL, defined as the maximum amount of pollutant that a waterbody can receive and still meet water quality standards, may be developed for some impaired waterbodies. A TMDL may establish requirements on the sources of a pollutant to reduce the pollutant load. Requirements can include, but are not limited to numeric limitations, target percent reductions, and restrictions on impervious cover.
The number of waterbodies on the 303(d) list has been increasing over the years, due in part to expanding water quality programs, water quality data gathering efforts by several stakeholders, and third-party litigation.
Since state DOTs have statewide systems, there is the potential to be involved in numerous TMDLs. The state DOTs must comply with load reductions mandated under the TMDL. In some cases, the TMDL requirements are not based on data that accurately reflects the pollutant contribution of transportation systems. In many cases, this is due to the lack of appropriate transportation datasets, modeling approach limitations, and poor communication between DOTs and environmental resource agencies regarding the unique aspects of transportation stormwater.
The costs associated with compliance programs for State DOTs can be extensive, requiring additional structural BMPS, increased inspection and maintenance, increased water quality assessments and recordkeeping and changes to standard practices for construction and vegetation management. Therefore, assessing potential performance measures for impaired waters and TMDLs may benefit state DOTs nationwide.
TMDLs are site-specific studies, with the pollutant of concern and requirements being unique to each one. Therefore, the performance measure recommended evaluates a programmatic metric instead of more detailed aspects to judge compliance. However, each TMDL assigned to a state DOT should have a specific plan for management and compliance.
Step P1: Determine the impaired waters and TMDL state of the practice
When planning projects in watersheds where TMDLs have been issued by USEPA or state environmental agencies, several state DOTs have developed simple spreadsheet models to estimate pollutant loads and load reductions achieved through the implementation of BMPs to meet the TMDL requirements (see insert titled “Impaired water programs”). Other state DOTs conduct monitoring at regulated outfalls to estimate pollutant loads.
A few state DOTs have been mandated to implement other watershed-based programmatic changes to improve water quality, sometimes outside the context of the TMDL program. For example, in response to a lawsuit, Massachusetts DOT started an Impaired Waters Program in 2010, which is discussed in the inset titled "Impaired water programs."
There has been a movement towards considering impervious cover as a performance measure across the country due, in part, to it being relatively easy to measure and forecast. However, while research by the Center of Watershed Protection (2003) and USEPA (2005) indicates that waterbody impairment is correlated with high impervious cover, they do not show causation. It is possible that high impervious cover relates to activities associated with urban areas, such as industrial discharges, construction stormwater runoff, and illicit discharges. High impervious cover might then be a symptom of urbanization rather than a cause of stream impairment. There is no science linking transportation impervious cover to poor benthic scores.
Often these watershed-scale analyses for impervious cover do not take into consideration BMPs that have already been implemented (Schueler and Fraley-McNeal, 2008). Additionally, safety requirements mandate minimum roadway widths and state DOTs are constrained to minimize land acquisition for right-of-way. Therefore, state DOTs may be limited in their ability to directly reduce impervious cover to meet requirements and may need to implement costly retrofits in order to achieve a relatively low impervious cover target.
During interviews, some state DOTs expressed concern over the potential for chloride TMDLs. The source of chloride in the transportation setting is from deicing operations, and source control is difficult without risking public safety.
Step P2: Identify best practices in impaired waters and TMDL
In order to quantify and manage waterbody impacts from transportation activities, state DOTs have adopted a variety of measures, including the following:
- Several state DOTs have developed a variety of tools for modeling annual pollutant loads, ranging from sophisticated models to simple spreadsheet tools. The use of simpler spreadsheet tools is often well received because it can promote a more transparent process than when using complex models.
- Several state DOTs have begun quantifying impervious cover, although the measure has several issues associated with it (see discussion in Step P4).
- Effective programs leverage other data sources such as outfall and BMP inventories to support wasteload allocation and reporting.
- Some state DOTs have robust research programs to develop DOT-specific data such as event mean concentrations and loads from different roadway types such as primary roads, secondary roads and bridges, and different BMP types. In many cases, these state DOTs have used the research to preclude themselves from TMDL requirements and/or demonstrate compliance with wasteload allocations.
- Incorporating GIS maps of impaired or other sensitive streams such as Outstanding Resource Waters or High Quality Waters in corridor selection and roadway design can help minimize or mitigate impacts.
- Developed collaborative relationships with state environmental agencies to promote a more thorough and accurate assessment of the state DOT before and during TMDL development.
Impaired waters programs
Massachusetts DOT started its Impaired Waters Program in 2010 in response to a federal court lawsuit. The program required the agency to assess a total of 684 waterbodies by the end of the permit term. When a TMDL exists, the agency addresses the impairment within the context of the TMDL implementation plan. However, when a TMDL does not exist, Massachusetts DOT uses impervious cover as a surrogate for stormwater-related pollution, rather than modeling for the range of impairments such as metals and nutrients.
When the waterbody is impaired for impervious cover, Massachusetts DOT will evaluate the feasibility of implementing stormwater retrofits, generally with infiltration BMPs. The impervious cover credits for each BMP type was developed by Massachusetts DOT, and is tied to the agency’s BMP inventory geodatabase.
Delaware DOT is required to prioritize two impaired watersheds over the term of its MS4 NPDES permit and prepare water quality improvement plans discussing implementation of BMPs to reduce the untreated effective net impervious cover by 3%. Other state DOTs including Virginia are subject to similar requirements.
Step P3: Identify existing resources for impaired waters and TMDL
FHWA and the United States Geological Survey (USGS) collaborated on the development of the Stochastic Empirical Loading and Dilution Model (SELDM). SELDM uses Monte Carlo simulations to produce random distributions of the input variable values to model real-world uncertainty. SELDM is an empirical model, i.e., one based on observed data rather than first principles. The model uses a mass balance approach to output individual storm event and annual loads for the area of interest. The primary advantage of SELDM, recognized by some of the interviewees, is the ability to base wasteload allocations on science rather than arbitrary allocations that were common in TMDL programs.
This project did not find any existing national resources to support the tracking of the proposed performance measure.
Spreadsheets-based accounting tools
The use of spreadsheet-based tools can support watershed planning activities by calculating (or accounting for) the existing pollutant load from a specified drainage area and comparing it to the load after a preliminary reduction is estimated from planned BMPs. This allows the state DOT to identify appropriate BMPs in impaired watersheds and communicate effectively with state environmental resource agencies on its efforts to reduce its contribution to waterbody impairment. Many such planning tools are developed in conjunction with or approved by the environmental resource agency.
North Carolina DOT uses a modified version of the state’s Jordan Lake Stormwater Load Accounting Tool (JLSLAT) for nutrient-impaired watersheds. The agency collaborated with the state environmental resource agency to develop the modified version of the tool to use the water quality dataset accumulated from 15 years of North Carolina DOT-sponsored research studies. This research indicated that the chemical characteristics of roadway runoff differed from other land uses enough to warrant a modified model. The model uses the simple method to estimate volume of stormwater runoff from impervious areas and to estimate the pollutant load exported within the runoff leaving the catchment. The user then selects a BMP or series of BMPs to estimate the pollutant load reduction the BMPs would provide. The result allows the user to determine if additional BMPs are necessary to meet the watershed requirements.
Other state DOTs have adopted similar accounting tools in collaboration with the state resource agencies.
Step P4: Identify and assess if performance measures for impaired waters and TMDLs are applicable and feasible
To assess the viability of performance measures for impaired waters and TMDLs, the project team chose the following metric for evaluation:
- Percentage of TMDLs with management plans in place:TMDLs may require the state DOT to develop or participate in a management plan to reduce pollutant loads. Even if not required, a plan for the state DOT to attain compliance with the TMDL would be valuable for planning purposes. A management plan could be called a watershed plan, attainment plan, or other name.
Table 3.11 evaluates the effectiveness of this performance measure using the assessment factors described in Section 2.
Table 3.11 Assessment of non-structural BMP performance measures
| Assessment Factor |
% TMDLs with management plans |
Improvements in the measure are expected to improve water quality |
3 |
The measure can be used to inform policy making and determine manpower and funding needs |
3 |
The measure is flexible enough to allow changes over time as technology and regulations change, with little change to the meaning of historical data |
4 |
The data that needs to be collected to support the measure is defined |
2 |
It is feasible and practical to collect, store, and report data |
4 |
The data is or can be collected within existing programs |
3 |
Total Score |
19 |
| Note: 5 is the highest ranking and 1 is the lowest ranking. |
The scores in Table 3.11 reflect the following considerations:
- Percentage of TMDLs with management plans in place: The existence of a plan does not always result in improvements to water quality, but the process of developing and tracking the plan may since it focuses attention to the topic; therefore, this measure scores moderately on improvements to water quality. Since the content of plans may not be standard nationwide, the definition of what is tracked is low, but this provides flexibility to each state to develop their own definition. This proposed measure scores moderately for other assessment factors.
Step P5: Identify resource needs to support watershed-based performance measures
To help facilitate performance measures for impaired waters and TMDLs, the following research projects should be considered:
- Develop a consistent and comprehensive protocol to assess a state DOT’s contribution to the pollutant load. This tool can be used to limit the suite of parameters of concern a state DOT might reasonably be expected to contribute to in the watershed. This too could also be used to evaluate the relative load from DOT compared to other sources in the watershed.
- Further evaluate the validity of using impervious cover as a surrogate for impaired waters assessments. A more in depth evaluation if impervious cover causes impaired streams and the potential for transportation systems to limit impervious cover is needed. Additionally, analyzing the costs associated with reducing impervious cover within existing rights-of-way would be beneficial.
- Further reporting is needed on annual pollutant loading rates and concentrations in stormwater from various road types and BMPs specific to the highways and bridges.
What can state DOTs do now to get started?
Prior to implementing the performance measure – percentage of TMDLs with management plans in place, a state DOT may need to develop some or all of the following tools:
- Participation in TMDL development as a stakeholder, to assess if the state DOT’s contributions have correctly been assessed.
- Stormwater BMP inventory, including appropriate design information to determine if the BMP was designed in accordance with the standards for “credit”
- Significant in-field data collection and quality assurance procedures to compile information to determine/validate DOT’s contribution
- BMP performance data to determine effective reduction in parameter of concern for each BMP type in the state DOT’s BMP manual or applied in the DOT setting
- Appropriate forms to collect data on new BMPs that are used to meet load reductions
- Centralized list of new construction projects with information on new impervious area and drainage area
Back to top
3.9 Topics Not Suited For Performance Measurement
While the previous topics were evaluated through the feasibility assessment protocol in Figure 2.2, the project team determined the following topics to be unsuited for performance measures, but nevertheless valuable to be discussed in this report:
- Stormwater research and monitoring
- Alternative compliance approaches
Both topics are not amenable to performance measurement for the following reasons:
- Topics are not universally implemented by state DOTs.
- Topics are fairly diverse based on geography, local concerns, stakeholder involvement, lawsuits, and other drivers that are not consistent nationally.
- Viable performance measures do not exist to track state DOT performance in these topics.
Stormwater Monitoring and Research
According to the USEPA ICR dataset, 14 state DOTs perform edge-of-pavement monitoring or other characterization of roadway stormwater discharges. In some cases, this information is used to support modifications to the state DOT’s manual or to support development of load accounting tools. On the other hand, other state DOTs compile monitoring data for regulatory applications only.
State DOTs currently conduct these projects with little coordination with each other. This often results in duplicative research and limited datasets. It would be preferable to have state DOTs collaborate on research projects to develop sufficiently extensive research monitoring datasets that can be used to determine the effect on BMP performance of various factors like climatic conditions, physiography, annual daily traffic loads, and other potential research variables.
The team identified the following centralized databases of research data:
- International BMP Database: A centralized database of performance data from a variety of participants including transportation, residential and commercial applications. Staff at state DOTs interviewed indicated they used the database in the design phase to evaluate appropriate BMPs. The limitations of this resource are: data is not necessarily representative of the highway environment; database does not contain edge-of-pavement characterization data; and data submissions have to go through a third-party validation process, which may not be appealing for state DOTs.
- Highway Runoff Database: Database developed by FHWA and USGS to support SELDM. This database is focused on highway data but is intended as a research and planning tool. While not intended for this application, there is potential for state DOTs to use this platform to house monitoring data and use in decision-making.
- NTPEP: Repository of erosion and sediment control products and associated testing data. The site maintains a summary of third-party evaluation of products like erosion control blankets, turf reinforcement mats or netting products. The site itself does not provide any data analysis, but it provides a valuable resource for state DOT staff developing construction SWPPPs or erosion and sediment control plans.
Alternative Compliance Strategies
In 2003, the USEPA issued its Water Quality Trading Policy in support of market-based approaches to compliance, which estimated that the national costs to implement TMDLs could be reduced by as much as $900 million with the use of these types of solutions. FHWA is currently evaluating the feasibility of a national framework for stormwater banking and crediting.
Three of the state DOTs interviewed have or are developing alternative compliance strategies:
- Maryland SHA has a well-established banking arrangement to help comply with the requirements of the Chesapeake Bay TMDL. When site constraints do not allow implementation of BMPs to meet Maryland stormwater regulations, Maryland SHA is allowed to implement an equivalent BMP at another location using the Maryland SHA Water Quality Bank. Credits are based upon the drainage area undergoing treatment, at a 1 to 1.20 mitigation ratio. This trading approach is facilitated by a presumptive performance standard.
- Oregon DOT also has a compensatory mitigation program but does not have a formal tracking system in place. Instead, the compensatory site is proposed during project planning, and subject to National Marine Fisheries Service approval. The compensatory mitigation site has to have similar site characteristics to the project site, and similar habitat value as assessed by Oregon DOT biologists in consultation with Oregon Department of Fish and Wildlife staff. Stormwater mitigation credits are not currently banked or tracked.
At the time of the interviews, another state DOT was in the process of collaborating with the state environmental resource agency to implement a two-tiered approach to stormwater management for new development or redevelopment. For priority projects, defined as projects with an Environmental Impact Statement or Environmental Assessment, or discharging to a 303(d) waterbody, no change was proposed. For other projects, the state DOT proposed to bank the expenses that would have been spent on BMPs during individual projects (estimated at $6.5 million annually) and use it to fund large regional watershed restoration projects in collaboration with other partners.
Back to top
4.0 Conclusions
This report included the preliminary assessment component of the feasibility assessment protocol. In this section, the project team present a series of recommendations to support development of stormwater performance measures for performance-based planning and programming. We also summarize recommendations discussed in Section 3 (with reference to the original discussion for greater detail) and include additional programmatic recommendations for stormwater programs. While some of these recommendations do not directly impact performance measurement, they do support greater program efficiency and advance the state of the practice.
4.1 Collaborative Development of Performance Measures
Section 3 presented an analysis of various stormwater topics and associated performance measures, evaluated using the six assessment factors discussed in Section 2. The individual scores for each of the six factors were added to compute a total score, shown at the bottom of each scoring table in Section 3. These factors are the result of the preliminary assessment only, based on information collected during the project. They do not factor in individual state DOT priorities or policy sensitivity. For that purpose, this shortlist should be presented to a Collaborative Development Panel, to be convened and consisting of 5-10 state DOTs that represent a diverse cross-section of the transportation stormwater community.
The following topics rated the highest in each topic area:
- Number of post-construction BMPs added to inventory (Section 3.2)
- Percent of projects needing construction SWPPPs with one in place (Section 3.3)
- Percent of industrial facilities with SWPPPs and/or SPCCs completed (Section 3.6)
- Number of post-construction BMP constructed annually (could be potentially merged with #1 if an inventory exists) (Section 3.3)
- Average LOS rating for post-construction BMPs (Section 3.1)
- Tons deicer/lane mile/winter severity index (Section 3.7)
- Percent of staff that receive required stormwater training (Section 3.4)
Back to top
4.2 Research Projects Needed to Develop Additional Resources
Based on analysis of various stormwater topics, the following research projects are needed to support further development of stormwater performance measures:
- Study relating maintenance practices for stormwater BMPs with their effect on water quality. This would help policymakers determine what an appropriate level of maintenance is while setting LOS targets and resource allocations (Section 3.1).
- Cost effectiveness of a field inventory of outfalls relative to water quality benefits. This information could help with communication with USEPA on the cost versus benefit of outfall inventory requirements (Section 3.2).
- Feasibility of establishing a consistent winter severity index that can be used to normalize deicer usage to account for variability in the severity of winter weather(Section 3.7).
- Validity of using impervious cover as a surrogate. With environmental resource agencies looking to this metric as a surrogate for stormwater pollution, there is a need to validate the science behind this approach. Information is also needed on the costs of compliance if impervious cover is adopted as a regulated parameter (Section 3.8).
Back to top
4.3 Protocols and Guidance Needed
The project team determined guidance or protocols developed nationally or collaboratively by multiple state DOTs on the following topics would be supportive of further performance measure development:
- Protocol to classify inspection and maintenance LOS. Each state DOT could define its own criteria for issues that would result in a BMP rated as needing “major repairs” versus “minor repairs”, but the protocol should define some broad principles and suggest some typical examples (Section 3.1).
- Guidelines for development of mobile computing solutions for managing stormwater BMP inspection data on phones, tablets and laptops. Guidance should identify the different types of data to be incorporated (e.g., BMP inventory, geospatial data), database architecture, naming conventions, data attributes, standardized definitions, work flows, and standard quality assurance procedures (Section 3.1).
- Inspection database architecture and data maintenance and validation approach. This information would be valuable for state DOTs without an inspection and maintenance database to implement one efficiently (Section 3.1).
- BMP inventory development guidance. State DOTs without a BMP inventory could benefit from guidance on standard geodatabase structure, data acquisition tools, and data management protocols (Section 3.2).
- Applicability of the “maximum extent practicable” and the “infeasibility” to linear systems, including guidance on how to determine BMP implementation meets the permit requirements for maximum extent practicable (Section 3.3).
- Assessment of effectiveness of training. State DOTs need protocols to determine if the training was useful in trainees’ work roles, how long the information was retained, and if the delivery of the information was appropriate (Section 3.4).
- Training matrix by employee role. State DOTs would benefit on guidance on how to identify specific training requirements for each role. This guidance would have to be flexible enough to be adapted to the different organizational structures of state DOTs (Section 3.4).
- Development and maintenance of construction SWPPPs, including BMP selection guidance, documentation, and recordkeeping (Section 3.5).
- Development and maintenance of SWPPPs and SPCC plans, including BMP selection guidance, documentation, and recordkeeping (Section 3.6).
- Appropriate secondary containment for products found at state DOT maintenance yards. Many state DOTs do not have the training to select coatings for secondary containment structures that will not react to some products, nor how to perform detailed inspections to verify the containment is sound. (Section 3.6).
- Quick reference guides and basic training on general pollution prevention needs (Section 3.6).
- Minimizing impacts from brine and salt management. Many state DOTs do not yet know that brine tanks require secondary containment (Section 3.6).
- Significant contributor protocol to assess a state DOT’s contribution to the pollutant load in a TMDL. This could be used by state DOTs to support limiting their responsibility in TMDLs to a more limited suite of transportation-impacted parameters (Section 3.8).
- Standardized Quality Assurance Plan for data collection in the linear system. Several state DOTs have implemented stormwater monitoring but inconsistencies between studies sometimes makes comparison across state DOT datasets difficult. Several FHWA references already exist (Strecker et al., 2001; Granato et al., 2003). The standard QAPP should engage stakeholders in collaborating on a single protocol that would allow cross-comparison of research data, while allowing for state-specific flexibility.
Back to top
4.4 New Tools Needed
The development of the following tools will support performance measurement or data management for stormwater:
- BMP construction cost database.Relatively few DOTs consistently compile construction cost data, including labor costs for design. Cost data is an important element of performance measurement, guiding resource allocation decisions. The database should include types of BMPs, construction costs, contributing drainage area, soil type, and maintenance costs.
- Planning-level watershed assessment tools. Some state DOTs like North Carolina and Florida have developed accounting tools to help with watershed-based planning and implementation of BMPs. These tools are less complex than the models used for TMDL applications, but are easy to use by DOT staff for planning purposes. Template watershed assessment tools could be developed for use by state DOTs, as long as they allow customization with state-specific load and concentration data or approved BMP performance efficiency ratings.
- Add-on Interface for FHWA Highway Runoff Database. While not the original purpose, the database can be expanded to make it easier for state DOTs to manage their research data and use to guide policy and development of manuals. New development could include data import tools, a graphic-user interface data query engine, and a data management system (Section 3.9.1).
- Repository of state DOT monitoring data using the FHWA Highway Runoff Database. This would allow state DOTs to collaborate on centralized research dataset to help support design and decision-making based on DOT data rather than parcel-based data (Section 3.3, Section 3.8).
- Repository of transportation-related training courses for basic awareness of stormwater awareness. While individual state DOTs will need to provide training on specific issues, introductory information such as general water quality impacts and nationwide regulatory concerns such as recordkeeping could be provided on a centralized platform or shared between state DOTs (Section 3.4).
- Guidance on quick reference guides and basic training on stormwater quality management (see Section 3.5 for discussion as applied to erosion and sediment control).
Back to top
5.0 References
Arizona DOT. 2010. Statewide Stormwater Management Plan. Prepared by Engineering and Environmental Consultants, Inc. Arizona Department of Transportation, Office of Environmental Services. March.
Caltrans. 2013. Year-End Performance Report. June 1, 2012 – June 30, 2013. CTSW-RT-13-299.01.1, September. California Department of Transportation, Division of Environmental Analysis, Storm Water Program.
Cambridge Systematics. 2011. Technical Guidance for Deploying National Level Performance Measurements. NCHRP Report 20-24(37)G. Prepared by Cambridge Systematics. April.
Center for Watershed Protection. 2003. Impacts of Impervious Cover on Aquatic Systems. Watershed Protection Research Monograph No. 1. March.
Effluent Limitations Guidelines and Standards for the Construction and Development Point Source Category, Final Rule. Federal Register 79:44 (March 6, 2014), pp. 12661-12667.
FHWA. 2013. Performance-Based Planning and Programming Guidebook. United States Department of Transportation, Federal Highway Administration. Report No. FHWA-HEP-13-041. Prepared by ICF International. September.
Granato, G.E., Zenone, C., and Cazenas. 2003. National Highway Runoff Water-Quality Data and Methodology Synthesis, Volume I – Technical issues for monitoring highway runoff and urban stormwater. FHWA-EP-03-054. U.S. Department of Transportation, Federal Highway Administration.
Maryland SHA. 2012. Maryland State Highway Administration Stormwater NPDES Program Standard Procedures Manual.
Massachusetts DOT. 2012. Environmental Management System Manual. February. Massachusetts Department of Transportation.
Missouri DOT. 2014. Design and Right of Way Division Tracker. Missouri Department of Transportation. January.
Nagle. 2014. Update on USEPA’s Stormwater Initiatives. Deborah Nagle, USEPA. Presented at the Municipal Wet Weather Stormwater Conference, USEPA and International Erosion Control Association (Southeast Chapter), August 18-19, 2014, Charlotte, NC.
Nevada DOT. 2012. Stormwater Management Program Annual Report for Fiscal Year 2012. Nevada Department of Transportation, Environmental Services Division.
Schueler and Fraley-McNeal. 2008. The Impervious Cover Model Revisited: Review of Recent ICM Research. Presentation last accessed September 1, 2014 and available at: http://chesapeakestormwater.net/wp-content/uploads/downloads/2012/01/ICM20Research20and20Planning20Implications1.pdf.
Strecker, E. Mayo, L., Quigley, M., Howell, J. 2001. Guidance Manual for Monitoring Highway Runoff Water Quality. FHWA-EP-01-021. U.S. Department of Transportation, Federal Highway Administration.
USEPA. 2005. Estimating and Projecting Impervious Cover in the Southeastern United States. EPA/600/R-OS/061. United States Environmental Protection Agency.
WSDOT. 2012. The Gray Notebook. Edition 45. Washington Department of Transportation, Strategic Assessment Office. May. Last accessed online at August 16, 2014 at: http://wsdot.wa.gov/publications/fulltext/graynotebook/Mar12.pdf.
Back to top

