Stormwater Best Management Practices in an Ultra-Urban Setting: Selection and Monitoring
Monitoring Case Study-Modified Delaware Sand Filter BMPs at Alaska Marine Lines, Seattle, Washington
This case study is based on an evaluation of two modified Delaware sand filters by Horner and Horner (1995).
The Alaska Marine Lines (AML) Filter BMP, which is an adaptation of the Delaware Sand Filter (DSF) BMP, was the first application of sand filters for stormwater treatment in the Pacific Northwest. The AML stormwater filter system, which consists of eight individual sand filter units, was constructed to treat stormwater runoff from a 5 ha (12.4 ac) container shipping and storage terminal yard. The AML site fronts both the West Marginal Way South (a major industrial arterial in Seattle's industrial area), and the Duwamish Waterway (a man-made waterway at the mouth of the Duwamish River approximately 4.8 to 6.4 km (3 to 4 river miles) upstream from Puget Sound). Construction of the redeveloped site and sand filter systems was completed in 1993. In accordance with local regulations, AML provided funding to monitor and evaluate the performance of its sand filter BMP system for one year.
Study Objectives
Design and Operation
The AML site is a completely paved L-shaped property of approximately 5 ha (12.4 ac) that has been redeveloped to ship, handle, and store cargo containers. Sand filters were selected for stormwater treatment based on their proven ability to handle petroleum-based contaminants washed from paved surfaces during typical storm events. In addition, because limited area for the terminal required paving and using the entire upland area available, the sand filter system offered an effective and practical alternative to other BMP designs. Based on state requirements for treatment of two-thirds of the runoff volume of a 2-year, 24-hour storm event, the sand filter system was designed to treat the first 31.2 mm (1.23 in) of runoff, allowing the excess to bypass the system. The AML sand filter system is designed with the majority of the eight units arranged along the perimeter of the site.
The AML site is graded so that runoff sheet flow drains at a 1 percent slope from the interior to the L-shaped perimeter of the site. A typical filter unit length is 53.4 m (175 ft), up to a maximum length of 73.2 m (240 ft). Filter unit widths were standardized to either 1.5 m (5 ft) or 3 m (10 ft). The filter chamber is filled to a minimum depth of 45.7 cm (18 in) of sand. The characteristics of the filter medium are given in Table 32. The completed trench is covered with a segmented concrete lid, having scuppers for stormwater inflow. Each filter chamber is equipped with inspection and clean-out ports to facilitate light maintenance without having to remove the concrete lids. Figure 57 shows a typical cross-section of an AML concrete sand filter trench unit.
Table 32. Filter medium characteristics
| Characteristics |
Provided |
Target |
| Uniformity Coefficient (UC) |
3.13 |
< 3.5 |
| Fines passing |
0.13 mm (%) |
0.2 < 1.0 |
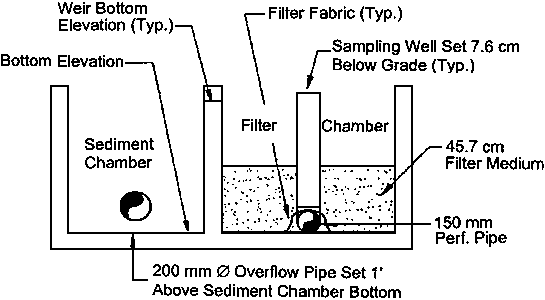
Stormwater runoff is initially retained within the first chamber, designed for settling and collecting sediment in the bottom of the chamber. Sedimentation chamber sizes are based on a surface area of 124 m2/ha (540 ft2/acre) of impervious catchment. This size provides a 10- minute detention time for the design storm. When the chamber is full, stormwater flows over control weirs located on top of the center wall separating the sedimentation chamber from the filter chamber (see Figure 57). The runoff then enters the sand filter chamber and percolates through for additional treatment. The design percolation rate through the sand filter medium is 2,523 L/m2 (62 gal/ft2) of sand per day.
The AML sand filter system contains several key innovative design modifications from earlier DSF BMPs, due to monitoring experiences from earlier DSF designs as well as the need to accommodate site-specific conditions for the AML site. The bed of each filter chamber contains a continuous, perforated drain pipe wrapped in filter fabric, which leads to a tee where a permanent vertical test well pipe is installed. A controlled overflow feature has been incorporated to accommodate the 100-year storm event. An appropriately sized overflow pipe in one end of the sediment chamber is set for a water elevation above that of the center wall weirs. The overflow pipe has a baffle to control discharge of oil and sediment during overflow conditions. Outflow from adjoining ends of adjacent filter trench units is then piped to an access hole. Each access hole receives water from both the filtered collection pipe and the sediment chamber overflows. The access holes are connected to the main underground header pipe, which discharges to the waterway. The trench lids with scuppers and inspection ports were constructed of AASHTO H-20 loading concrete panels to support potentially significant vehicle loads.
Monitoring Program
Of the eight filters designed and constructed, two were chosen to be included in the monitoring program. The two filters chosen received runoff from areas of distinctly different activities, representing two different magnitudes of potential runoff and pollutant loading. The first installation of monitoring equipment was placed at Filter No. 3, located on the north edge of the property line. Filter No. 3 was categorized as a location of intense truck loading and unloading activity and movement. The second monitoring location was at Filter No. 6, categorized as a location of low activity with no truck loading or unloading.
The goal of the stormwater monitoring program was to sample as many winter, spring, and summer storms as possible to develop a representative sample. The target sample number was set at 20 storm events minimum. Unfortunately, only nine natural storms had been monitored by the target date, so it became necessary to supplement the missing 11 storms using artificial runoff created by spraying from a nearby fire protection system. Careful attention was paid to the amount of runoff produced using artificial spraying in order not to exceed the target design storm. Artificial storms were representative of the general characteristics of natural storms, except for having higher hydraulic loading rates.
A series of samples were composited during each monitored storm in 10-liter carboys on a flow-weighting basis. Flow weighting was achieved by programming the flow meter to transmit pulse signals to the samplers to take a set volume each time a specific flow volume registered. Sampling intervals were programmed to allow monitoring of runoff from the mean 24-hour (31.2 mm [1.23 in]) of runoff) storm falling on the area of the sand filter catchments without overfilling the carboys. The water quality variables examined in the monitoring program were pH; temperature; total suspended solids (TSS); turbidity; zinc (Zn); fats, oils, and grease (FOG); total petroleum hydrocarbons (TPH); total phosphorus (TP); and copper (Cu). The results of the monitoring program are shown in Tables 33 and 34 (treatment efficiencies are based on mean concentration removal efficiencies).
Table 33. Effectiveness for filter no. 3 (%)
| Parameter |
Natural Storm |
Artificial Storm |
Combined Storm |
| TSS |
88 |
80 |
83 |
| Turbidity |
43 |
1 |
17 |
| FOG |
76 |
> 88 |
> 84 |
| TPH |
> 83 |
> 86 |
> 84 |
| Cu |
-133 |
61 |
22 |
| Zn |
-39 |
86 |
33 |
| TP |
61 |
36 |
41 |
Table 34. Effectiveness for filter no. 6 (%)
| Parameter |
Natural Storm |
Artificial Storm |
Combined Storms |
| TSS |
-48 |
45 |
8 |
| Turbidity |
-98 |
-63 |
-81 |
| FOG |
> 60 |
76 |
> 69 |
| TPH |
> 31 |
> 71 |
> 55 |
| Cu |
-4 |
65 |
31 |
| Zn |
55 |
83 |
69 |
| TP |
16 |
25 |
20 |
A separate analysis was made of the condition of the sediments accumulated in the settling chambers and the condition of the sand beds in the filter chambers to define potential maintenance needs. Sediment samples from the settling chambers and sand cores from the filter chambers were collected separately for analysis. Particle size distributions and pollutant concentrations in sand samples collected from the two filters were compared with those of clean sand to assess changes that had occurred during the seven months of operation prior to sampling. Pollutant concentrations in sediment and sand were also compared.
Conclusions
-
Monitoring was fairly representative of the prevailing conditions and generally met the criteria established at the beginning of the program.
-
The sand filter system consistently reduced total suspended solids (TSS); total petroleum hydrocarbons (TPH); fats, oils, and grease (FOG); zinc (Zn), and copper (Cu). Removal efficiencies approached on average 80 percent, except for copper which averaged 62 percent.
-
Effectiveness in reducing total phosphorus (TP) was generally lower and less consistent than for the other pollutants.
-
The sand filter system is less effective in capturing small solids that most influence turbidity.
-
Based on sand core analyses after seven months of operation, it is estimated that the sand filter systems will provide several years of service before needing major maintenance.
-
Sediment samples from the settling chambers and whole sand cores from the sand chambers collected after seven months of filter operation did not come close to violating any leachable metals criteria for designating hazardous or dangerous waste. However, the sediments exceeded TPH criteria under toxics control legislation and would have to be treated as hazardous waste if removed during maintenance.
-
Analysis of the monitoring results indicates that the filters performed more effectively when there were higher concentrations of pollutants in the influent runoff. These observations suggest there may be thresholds of pollutant concentration below which the water quality benefits of the technology are marginal.
References
Horner, R.R., and C.R. Horner. 1995. Design, Construction, and Evaluation of a Sand Filter Stormwater Treatment System. Part II. Performance Monitoring. Report to Alaska Marine Lines, Seattle, WA.
Spearman, J.W., and S.R. Beard. 1995. Design, Construction, and Evaluation of a Sand Filter Stormwater Treatment System. Part I. Design and Construction. Report to Alaska Marine Lines, Seattle, WA.
|

