Mountain View Corridor, Utah
Case Study Introduction
Project Overview
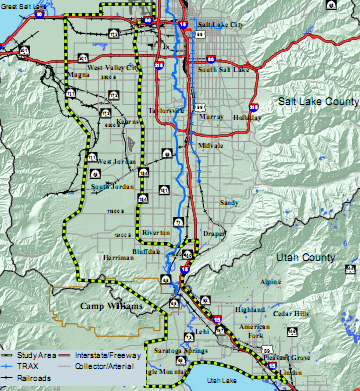
The Mountain View Corridor (MVC) is a combined highway, transit,
and trail system in western Salt Lake County and northwestern Utah
County in Utah. The highway component of the corridor is a 35-mile
north-south freeway from I-15 in Utah County to I-80 in Salt Lake
County. The transit component is a 20-mile fixed guideway
transitway from Herriman to the Salt Lake International Airport.
The trail component runs adjacent to the freeway, where free from
environmental constraints.
Figure 1: Map of Mountain View Corridor Study Area
The need for a continuous north-south transportation facility
from western Salt Lake County to northern Utah County has been
identified in long-range transportation plans since the 1960s. The
MVC NEPA study was initiated in May 2003.[1] The environmental document
was prepared by the Federal Highway Administration (FHWA) as the
lead federal agency and the Utah Department of Transportation
(UDOT) and the Utah Transit Authority (UTA) as project sponsors and
the lead state agencies. FHWA signed the MVC Final Environmental
Impact Statement (FEIS) on September 3, 2008, and the Record of
Decision (ROD) on November 17, 2008. The MVC freeway will be built
using a phased approach. Construction on the initial build segments
of Phase 1 began in Fall 2009 for Utah County and Spring 2010 for
Salt Lake County. Phase 1 of the transit component is anticipated
to be constructed and operational by 2015.
The MVC project has primary and secondary purposes. The primary
purpose of the MVC is to improve regional mobility by reducing
roadway congestion and to improve regional mobility by supporting
increased transit availability. Secondary purposes are to support
local growth objectives, to increase roadway safety, and to support
increased bicycle and pedestrian options.[2]
The major transportation needs in the MVC study area are a
result of rapidly growing population and employment in the area.
The population in the study area is expected to increase by 122%
from 258,000 in 2005 to 574,000 in 2030. Employment in the study
area is expected to increase by 208% from 89,000 in 2005 to 274,000
in 2030. The roadway network in the study area primarily consists
of arterial streets that are not intended to accommodate a high
volume of long-distance through trips and freight movements. The
transit network consists primarily of local and express bus
service.[3]
Travel Forecasting Summary
UDOT used the Wasatch Front Regional Council (WFRC) /
Mountainland Association of Governments (MAG) regional travel
demand forecasting model to develop forecasts for the MVC EIS. WFRC
is the designated Metropolitan Planning Organization (MPO) for Salt
Lake, Davis, and Weber counties, and MAG is the MPO for Utah
County. The two MPOs share a single four-county regional travel
model.
The WFRC/MAG regional travel model is implemented within the
CUBE/Voyager modeling software with the application written in TP+
scripting. The model includes 1,296 internal Transportation
Analysis Zones within the 4-county region. External traffic
entering and exiting the region does so through 24 external zones.
The model is based on the traditional four-step modeling process of
trip generation, trip distribution, mode choice, and trip
assignment. The WFRC/MAG model incorporates these steps and adds an
auto ownership model that is sensitive to urban design variables.
The model has a feedback loop between trip distribution and
assignment that allows travel congestion to influence trip
distribution.[4]
UDOT selected 2030 as the forecast year for the MVC EIS. This
was done to be consistent with the WFRC and MAG Regional
Transportation Plans, which also have 2030 as their horizon
year.
Case Study Illustration of the Guidance
The MVC study provides good illustrations of three of the key
considerations contained in FHWA’s Guidance on the
Application of Travel and Land Use Forecasting in NEPA. The
development and execution of the travel demand model for MVC used a
collaborative process with area stakeholders that began with
outreach during the NEPA scoping process, continued through several
model updates, and included analysis of the effects of sequencing
the transit and roadway improvements that was documented in the
FEIS. These activities represent pre-planning of the modeling
effort, using flexibility in the model to analyze performance and
impacts of the alternatives, and managing the project and
associated level of effort effectively and in coordination with
other agencies with jurisdiction. This case study emphasizes
considerations 3. Scoping and Collaboration on Methodologies, 4.
Forecasting in the Alternatives Analysis, and 5. Project Management
Considerations, of the guidance.
Key Consideration 3 of the Guidance: Scoping and Collaboration
on Methodologies
Reaching Consensus on Forecasting Methodologies
Peer review and collaboration were important parts of the MVC
forecasting process. This effort began in conjunction with the NEPA
scoping process and involved the efforts of Envision Utah, a
nonprofit organization, to define appropriate land use inputs to
the model.
Growth Choices Process
The MVC EIS used a unique set of land use inputs to evaluate the
build alternatives, referred to the “Growth Choices”
land use. The collaborative Growth Choices process involved
governmental agencies and stakeholder groups and focused on the
relationship between transportation and land use specifically
within the study area of the MVC project. The process was intended
to help cities in the MVC study area understand the relationship
between land use policy changes and transportation choices, and to
facilitate agreement on a vision of future development with unified
land use and transportation policies. At the end of the process, a
“Vision Scenario” was developed and agreed upon by the
participants. Within the MVC study area, the Vision Scenario
imagines increased population densities and mixed-use developments
along transit corridors.[5]
Given that the project area encompassed the jurisdictions of two
MPOs, two counties, and numerous communities and governmental
organizations, and given lessons learned during other projects in
the region such the controversial Legacy Parkway Project, the
project’s sponsors recognized the importance of facilitating
agreement about the vision of future development among the parties
with interest. UDOT contracted Envision Utah, a public/private
partnership and nonprofit organization based in Salt Lake City, to
facilitate decision-making on the growth scenarios for MVC.
Envision Utah’s mission is the study of the effects of
long-term growth in the greater Wasatch area in Utah. The process
developed by Envision Utah for MVC was referred to as the
“Growth Choices” process.
The advisory group established for the Growth Choices process
consisted of the governmental organizations mentioned, along with
private developers, nongovernmental organizations such as the
Sierra Club, elected officials, and religious organizations.
The NEPA scoping process was combined with workshops for the
Growth Choices process. Six scoping meetings/workshops were held,
with an emphasis on interactive exercises. The meetings were
attended by roughly 300 people. From the feedback provided during
the meetings, and with the aid of GIS, three growth scenarios were
developed that eventually fed into the development of a composite
Vision Scenario. The Vision Scenario balanced improvements among
roadway and transit modes and considered land use goals.
The project employed the results of the Growth Choices process
directly in several ways:
- Incorporation in the Purpose and Need. Both
primary and secondary objectives identified as part of the Growth
Choices process were reflected in the Purpose and Need statement
for the project, including reducing roadway congestion, supporting
increased transit availability, increasing roadway safety,
supporting non-motorized transportation options, and supporting
local growth objectives.
- Incorporation of the transportation elements of the
Vision Scenario in the alternatives analysis. While it was
initially assumed that the Growth Choices Vision Scenario would
result in an alternative that would stand alone for analysis in the
EIS, during the course of the study it was decided to incorporate
the land use and transit elements of the Vision Scenario into all
the alternatives. One outcome of this approach was the maximization
of transit usage in the traffic forecasts used in the EIS.
- Incorporation in the impact assessment. Land use
under the Growth Choices Vision Scenario was used to evaluate the
indirect impacts of the build alternatives and to compare them to
the No-Action Alternative.
Coordination and Peer Review
Coordination and peer review were ongoing elements of the
modeling process. The MVC consultant team worked closely with the
MPO staff, who maintain the WFRC/MAG model, and their modeling
consultant, who helped build the model. Peer review involved the
MPOs, their consultant, and FHWA. This coordination was key during
the development of the toll and managed lanes forecasting
capability. Extensive internal review was conducted with close
collaboration among three consulting firms with varying degrees of
expertise in the WFRC/MAG model, travel forecasting, and toll
forecasting for investment grade studies.
Aside from agency and consulting staff charged with building and
operating the model, coordination also occurred with the Sierra
Club throughout the study. The Sierra Club, which along with Utah
Moms for Clean Air, held membership on the project’s Air
Quality Working Group (AWG), was also a participant in the Growth
Choices process. Following completion of the DEIS, the Sierra Club
was provided with the files from the travel demand model for
review.
Documentation of Scoping and Interaction with Other
Agencies
The Growth Choices process was a distinct, but related, effort
from the development of the NEPA document and travel demand
modeling for MVC. As such, it produced a study document that became
an appendix to the FEIS. The “Mountain View Corridor Growth
Choices Study” provided an overview of the process, discussed
the workshops and feedback provided at them, explained the process
for creating the scenarios, discussed the lessons learned, and
included the signatures of the key stakeholder representatives,
documenting their endorsement of the goals of the study. The study
document itself adopted a glossy, reader-friendly format with
numerous graphics and maps to illustrate the results of the study
process.
Key Consideration 4 of the Guidance: Forecasting in the
Alternatives Analysis
Overview of Transportation-Related Effects and Impacts
The travel demand model was used to analyze the effect that the
sequence of construction—implementation of transit
improvements versus roadway improvements—would have on land
use, air quality, and travel performance in the study area. All of
these issues were identified as concerns during the Growth Choices
process, and were codified in the Mountain View Vision Voluntary
Agreement, a copy of which is included in the Growth Choices study
document. This agreement, which was signed by all of the
communities, the MPOs, several interest groups (including the
Sierra Club), and at least one developer, included a recommendation
that the sequencing of transportation investments be considered
with a goal of reducing the rate of growth of the vehicle miles of
travel and improving air quality. The issue of the sequencing of
the modes had been identified during the scoping process and
continued to be an issue of concern throughout the Growth Choices
process and into the development of the FEIS.
Objective Application of Forecasting Data and Methods
Consistent and objective application of forecasting data and
methods is central to providing an equitable analysis of
alternatives considered during a study. The MVC study, by
developing and using the Vision scenario from the Growth Choices
process, maintained consistency in the land use assumptions and
no-build networks used in the model while evaluating
alternatives.
These assumptions varied somewhat during the sequencing analysis
that was completed during the development of the FEIS, which
assessed the land use changes associated with the order in which
transit and roadway improvements were constructed. The Vision
Scenario continued to be a consistent input in the analysis;
however, the addition of compact land use scenarios provided a
broader assessment of impacts. The impact of different sequencing
options was addressed through both qualitative and quantitative
analyses. The qualitative analysis involved interviews with
professional staff from communities in the study area and with
developers. The quantitative analysis used version 6.0 of the
WFRC/MAG travel forecasting model to analyze land use and
implementation scenarios for 2015 and 2030. This is discussed in
more detail under the heading “Addressing Land Development or
Redistribution Effects.”
Refinement of the Analysis During Screening
During the course of the MVC EIS process, it was decided that
the possibility of building the MVC freeway as a toll road would be
studied. At that time the WFRC/MAG travel model was unable to
analyze toll facilities. Therefore, the project team updated the
model, with additional consulting support and an internal peer
review process, in order to perform the required tolling
analysis.
The mode choice and traffic assignment models were modified to
include the choice to use a toll facility, HOV facility, or an HOT
facility as discrete choices in the mode choice model. This allowed
toll facilities to compete directly with transit and HOV lanes.
Using data supplied by other members of the project team, the
constants and parameters associated with the tolling aspects were
adjusted to come up with a reasonable usage of the toll facility
and a reasonable comparison of toll trips to time saved. Particular
attention was paid to toll diversion curves, which showed the
percentage of drivers who would be willing to use a toll facility
for different amounts of time savings. Diversion curves and model
parameters from other regions were compared to output from the
WFRC/MAG travel model.
Addressing Land Development or Redistribution Effects
The MVC project applied three different approaches to addressing
land development and redistribution, each of which was applicable
to a different stage of the project and completed in reaction to
changes in conditions or input from stakeholders. The first was the
Growth Choices process, which maintained the control totals of the
MPO’s forecasts but reallocated population and employment
based on input from stakeholders. This effort was initiated at the
beginning of the study. The second was the sequencing analysis that
considered the redistribution effects of implementing transit
alternatives before and in conjunction with roadway alternatives.
This effort was undertaken during the development of the FEIS. The
final effort was a sensitivity test of the MPO’s 2007 revised
land use forecasts, which differed from the Growth Choices Vision
scenario that had been adopted for the project. For this approach,
a sensitivity test was completed by UDOT consultants to determine
the effect that using the latest MPO forecasts would have on prior
work. This effort also occurred during the development of the
FEIS.
Growth Choices Process
The MVC EIS used a unique set of land use inputs, referred to
the “Growth Choices” land use, for evaluating the build
alternatives. The Growth Choices process was a collaborative effort
that involved governmental agencies and stakeholder groups. The
process was intended to help the cities in the MVC study area
understand the relationship between land use policy changes and
transportation choices and to facilitate agreement on a vision of
future development with unified land use and transportation
policies.
Through a series of public workshops, three growth scenarios
were developed reflecting a range of development possibilities.
More information on the Growth Choices process can be found in
Chapter 3, Growth Choices[6], in the FEIS. At the end of the
process, a “Vision Scenario” was developed and agreed
upon by the participants. The Vision Scenario was a composite of
three distinct land use scenarios that were developed using data
gathered during the Growth Choices workshops and then enhanced
using GIS. Within the MVC study area, the Vision Scenario envisions
increased population densities and mixed-use developments along
transit corridors.
Sequencing Analysis
Two different approaches were used to analyze the potential for
the sequence of transportation improvements to affect land
development and redistribution. The qualitative process used an
interview process to gather information from local officials and
developers about the area would develop differently if transit were
implemented before the roadway elements of the alternatives and if
it would result in more transit-oriented development being
constructed along the proposed transit alternative.
Local officials interviewed during for the qualitative analysis
noted that municipalities would not be likely to make land use
decisions based on the sequencing of the alternatives. Rather, land
use decisions would continue to be made in accordance with adopted
plans. However, if the transit alternative were constructed first,
then it would be likely that plans would be altered at some point
to create higher density development adjacent to the transit
alternative. The interviewees, however, thought that the scope of
the land use changes in their plans would be limited to areas near
the transit alternative and were unlikely to result in changes
throughout their communities.
Similarly, developers interviewed held the opinion that their
plans were not dependent on the timing of the modal alternatives.
In general, developers are reactive to the adopted land use plans
of the communities in which they operate, as well as market
conditions.
The quantitative process used Version 6.0 of the WFRC/MAG model
to apply a numerical approach to the analysis. The quantitative
process analyzed a near-term year of 2015 and a long-term horizon
of 2030, focusing on the following characteristics:
- Person trips by purpose and mode
- Daily transit trips that have an origin or destination in
the study area
- Daily boardings for the 5600 West Transit Alternatives,
Dedicated Right-of-Way Transit Option
- Peak period transit share for trips that have an origin
or destination in the study area
- Peak hour transit share for trips that have an origin or
destination in the study area
- Vehicle miles traveled for the study area and the
region
- Hours of delay in the study area
The model runs compared scenarios that considered land use and
transportation improvements in various combinations. The No-Action
Alternative was included for comparison. The transportation options
considered were:
- No action
- Transit implemented first
- Tolled and non-tolled highway improvements, implemented
after transit and at the same time
For the forecast year of 2015, the results of the modeling
showed less than 1percent difference in regional auto trips between
the alternatives of building transit first versus building transit
in conjunction with a MVC roadway improvement. For this period, the
difference in transit trips generated between the no-action
scenario and the best performing transit scenario, which combined a
transit-first option with concentrated development from the Growth
Choices scenario applied only in the area adjacent to the transit
line, was in the range of 5percent. Of note was the finding that
the transit-only scenarios resulted in a substantial increase in
roadway delay by 2015. The amount of delay depended on whether the
roadway alternative was tolled or non-tolled.
The 2030 analysis considered the same transportation options as
the 2015 analysis, but it also considered additional Growth Choices
scenarios. As with the 2015 forecasts, concentrated growth near the
transit line, from either scenario, resulted in increased daily
transit trips. As before, transit-only scenarios resulted in
increases in roadway delay compared to scenarios in which the
roadway and the transit were constructed at the same time.
For both analysis years, the factor that had the most positive
influence on transit ridership was the density of land use,
particularly near the transit line. The timing of the
implementation of the roadway alternatives had less influence on
transit ridership; however, by delaying roadway improvements,
vehicle hours of delay increased substantially.
Review of New MPO Forecasts
In 2007, prior to the FEIS, the MPO released a revised land use
forecast, which differed from the land use forecast used in the
DEIS. The 2007 forecast redistributed growth in the region,
resulting in a 25 percent decrease in the vehicle miles traveled on
the Preferred Alternative.
To assess the differences in the forecasts, an independent
consultant was engaged to determine which forecast should be used
as the study continued. The consultant determined that the 2007
forecast had not been thoroughly vetted and identified some data
errors in the project 2007 projections which resulted in the latest
forecast overestimating redevelopment and underestimating
development. The consultant recommended continuing with the 2005
forecast used in the DEIS.
For more information about the 2007 forecast, see the
“Consistency” section in the discussion of Key
Consideration 5 of the Guidance: Project Management
Considerations.
Documentation of Forecasting in Alternatives Analysis
Multiple technical memoranda were developed to document the
methodology and results of the travel model development. In
addition, separate documentation was developed, both for the file
and for public distribution, to document the Growth Choices
process. Some of these materials were integrated directly into the
DEIS and FEIS.
Key Consideration 5 of the Guidance: Project Management
Considerations
Potential for Reevaluating Analysis
During the course of the MVC EIS process, the WFRC/MAG model and
associated land use inputs went through several modifications. Five
different model versions with five different land use data inputs
were used throughout EIS process. Sensitivity analyses were
performed with each model change to determine how much these
changes affected the traffic forecasts.
One change in model versions was directly attributable to the
MVC project. When it was decided that the MVC EIS would consider
tolling as a means of funding the investments in the corridor, the
WFRC/MAG model had to be modified to include this capability. The
MVC EIS Team, which included toll modeling experts from around the
country, performed this modification. Toll model data and
sensitivities from other regions were used to ensure that the model
performed adequately in developing toll road volumes.
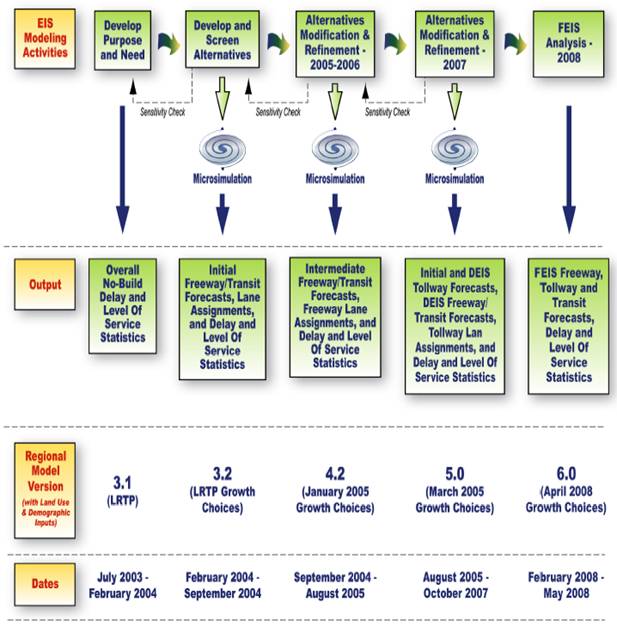
The EIS process comprised four separate phases—Purpose and
Need, Initial Screening, Refined Screening, and Final
Analysis—each of which used a different version of the model.
Figure 2 lists each EIS process phase and the corresponding model
version and SE data set used, along with a brief summary of changes
that were made from the previous version.
With each round of analysis and each new model, sensitivity
tests were completed to understand the implications of the new
model on forecasts and prior decisions. The MVC study occurred
during a period of intensive model development work in the region
and the goal of the MVC Team was to use current data and models,
even if it meant redoing some of the analysis. The use of
sensitivity tests and documentation of the model changes and
effects of model changes helped make this manageable. More
information is available in MVC Technical Report #5, “Overall
Travel Demand Modeling Methodology.”
Consistency
The MVC EIS took 6 years to complete. During that time, the
Wasatch Front Regional Council released three different long-range
land-use projections to 2030. The first land-use projections were
available when the study began. The second set of projections was
released in 2005, following changes to the Utah Governor’s
Office of Planning and Budget county-level growth projections. The
2005 WFRC projections in Salt Lake County were quite similar to the
previous projections in terms of the allocation of anticipated
growth, with differences due mainly to a revised set of
macro-economic assumptions about the overall magnitude of
population and employment growth by county. The third set of
projections was released by WFRC in 2007, just before the Final EIS
was prepared. The 2007 WFRC projections are very different from
prior long-range growth forecasts produced by WFRC, and that
difference warranted a very careful review of the land use
forecasts.
Figure 2 shows a flow chart of EIS Modeling Activities, Model Outputs, the Regional Model Version and Land Use input version, and the dates of the activities. The first activity, from July 2003 to February 2004, used model version 3.1 and LRTP land use to develop purpose and need and produced overall no-build delay and level of service statistics. The second activity, from February 2004 to September 2004, used model version 3.2 and LRTP growth choice land use to develop and screen alternatives and after microsimulation produced initial freeway/transit forecasts, lane assignments, and delay and level of service statistics. The third activity, from September 2004 to August 2005, used model version 4.2 and January 2005 growth choices land use for Alternatives Modification and Refinement (2005 - 2006) and after microsimulation produced intermediate freeway/transit forecasts, freeway lane assignments, and delay and level of service statistics. The fourth activity, from August 2005 to October 2007, used model version 5.0 and March 2005 growth choices land use for Alternatives Modification and Refinement (2007) and after microsimulation produced initial and DEIS tollway forecasts, DEIS freeway/transit forecasts, tollway lane assignments, and delay and level of service statistics. The fifth activity, from February 2008 to May 2008, used model version 6.0 and April 2008 growth choices land use for FEIS Analysis (2008) and produced FEIS freeway, tollway and transit forecasts, delay and level of service statistics.
Figure 2: MVC Modeling Process[7]
WFRC’s 2007 land use forecast assumed much more
redevelopment and infill of built-out neighborhoods on the
east-side of Salt Lake County compared to the projections produced
in previous years. Generally speaking, WFRC’s 2007 forecast
assumed that more development will be concentrated along
established transportation corridors, with less growth placed in
emerging growth areas. The 2007 WFRC forecast assumed much higher
growth east of Bangerter Highway than the 2005 forecast, and
conversely, the 2007 forecast for the west-side of Salt Lake County
went down substantially relative to prior forecasts. Residential
growth on the land inside the MVC study area decreases by more than
20percent and nonresidential growth by nearly 50percent.
Land use forecasts are the most critical input to a
transportation model. People and jobs generate the need for travel,
and the spatial separation of people and jobs largely accounts for
travel patterns. The 2007 changes to WFRC’s 2030 land use
forecasts in Salt Lake County resulted in a 25percent decrease in
vehicle miles travelled on the proposed Preferred Alternative.
Given the dramatic changes in travel demand in the MVC corridor,
an outside consultant was hired to review the various land-use
forecasts and to provide a recommendation to the MVC Team regarding
what land use forecasts to assume. A thorough study was conducted
in four phases:
1. Review the methodological differences that led to differences
in land-use projections.
2. Examine recent and long-term growth trends in Salt Lake
County to understand existing development patterns and emerging
trends.
3. Produce an independent forecast of growth for Salt Lake
County, relying on available data on vacant land, environmental
constraints, and land use plans.
4. Compare the different forecasts and trends and make an
informed recommendation to the project team and WFRC regarding
reasonable forecasts for land use growth in the study area.
The outcome of the review was a recommendation to continue using
the forecasts developed in 2005, with a few relatively minor
changes. It was found that the forecasts produced in 2007 included
some unfortunate data errors, had not been thoroughly vetted, and
generally overestimated redevelopment and underestimated
development in the rapidly growing portions of the region. The land
use projections developed in 2005 and used in the MVC DEIS were
comparable to an independent land use projection developed by the
consultant both in total and in terms of the allocation of growth
at the travel analysis zone level. The independent forecast and the
forecast used in the DEIS both were consistent with development
trends, with the availability of vacant land in the county, with
specific plans of developers, and with the adopted land use plans
in the corridor.
Therefore, the MVC EIS forecasts are based on a different land
use projection than was used by the MPO at the time for long-range
planning. The justification for this difference came from a careful
review of the land use growth patterns in the region and the
reasonableness of the various available forecasts. This analysis
was documented in a separate study, “Review of the Wasatch
Front Regional Council’s Latest Land-Use Projections.”
The documentation was included in project files and also in
Appendix 2A of the FEIS, and was therefore directly available for
resource agency review. Further, the results of the independent
consultant’s work were coordinated with WFRC, who concurred
in writing with the recommendation to continue using the 2005
forecast in the FEIS.
Enhanced Communication between NEPA Study Team and Forecasting
Practitioners
While the project did not have a formalized Project Management
Plan, internal coordination on MVC was structured and effected
through regular team meetings. The UDOT and consultant project
managers and appropriate task leads and met on a regular basis
throughout the project for interdisciplinary discussions about the
status of major tasks and study products.
Agencies with jurisdiction, including the MPOs, were involved in
formal (scoping) and informal coordination. The information
coordination consisted of project-level meetings and coordination
at key points in the project development, such as purpose and need,
alternatives development and refinement, and in advance of field
studies for resource issues. The MPOs were involved in additional
coordination as new travel demand and land use models were adopted
or released.
The project also benefited from having one UDOT project manager
throughout the course of the project, including into
implementation. This consistency aided in ensuring that project
issues were treated equitably throughout the NEPA process, that
relationships with key stakeholders and team members had time to be
well-developed, and that important concerns were not accidentally
discarded through transitions in project leadership. Additionally,
several of the major tasks leads, including the environmental lead,
were consistent throughout the project.
Senior management reviews were conducted on a less frequent, but
still regular basis. Such senior reviews served dual purposes: (1)
providing timely direction from leadership on critical issues and
decisions, and (2) creating an opportunity for briefing senior
staff on the status of the project and any concerns that other
state or federal agencies may have.
Additional Background and Sources
FEIS and ROD
The FEIS was produced as an eight volume document. Much of the
information used in this case study was contained in Volume 1 and
associated appendices. Chapter 1 of the FEIS contained the purpose
and need for the project. Chapter 2, Alternatives, and Appendix 2A
contained detail about the revised travel demand model. The Growth
Choices process is discussed in Chapter 3 and land use is discussed
in Chapter 4. Chapter 29, which is contained in Volume 3, was a
source for the sequencing discussion.
FHWA signed the MVC Final Environmental Impact Statement (FEIS)
on September 3, 2008, and the Record of Decision (ROD) on November
17, 2008.
Technical Reports
- WFRC & MAG Transportation Model Documentation, 2005
Base Year Model, Version 6.0, May 2007
- Mountain View Corridor Technical Report #05: Overall
Travel Demand Modeling Methodology, September 23, 2008
- Mountain View Corridor Growth Choices Study, Appendix 3A
of the FEIS
Contacts
Reed Soper
Utah Department of Transportation
MVC Environmental Manager
(801) 743-7847 direct
(801) 965-4000
[1]
Record of Decision of the Environmental Impact Statement, Mountain
View Corridor Project in Salt Lake and Utah Counties, Federal
Highway Administration, November 17, 2008, page 5.
[2]
Mountain View Corridor Final Environmental Impact Statement,
Chapter 1: Purpose and Need for Action, September 2008, page
1-5.
[3]
Mountain View Corridor Final Environmental Impact Statement,
Chapter 1: Purpose and Need for Action, September 2008, pages 1-7,
1-11, and 1-12.
[4]
WFRC & MAG Transportation Model Documentation, 2005 Base Year
Model, Version 6.0, May 2007, pages 9 and 11.
[5]
Mountain View Corridor Technical Report #05: Overall Travel Demand
Modeling Methodology, September 23, 2008, page 2.
[6]
Federal Highway Administration and Utah Department of
Transportation. Mountain View Corridor Final Environmental
Impact Statement. September 2008. pp. 3-1 to 3-22.
[7]
Source: MVC FEIS Figure 2-1.2

