
Livability Tools Promote Environmental Decisionmaking in Early Stages of Planning
In recent years, communities have tried to better measure livability in both qualitative and quantitative terms. To look at a community’s progress in statistical terms, practitioners have certain indicators, such as housing, economic, and demographic data, at their disposal to compare their community to others and track changes for important issues over time. This data helps both residents and planners understand the results of policies, identify where progress has been made, and highlight changes or disparities that are inconsistent with community goals. Developing a more “livable” community will mean something different to each locale, so metrics must be customized. This can be challenging for communities because there are hundreds, if not thousands, of potential metrics that can be used to achieve any number of “livability” goals.
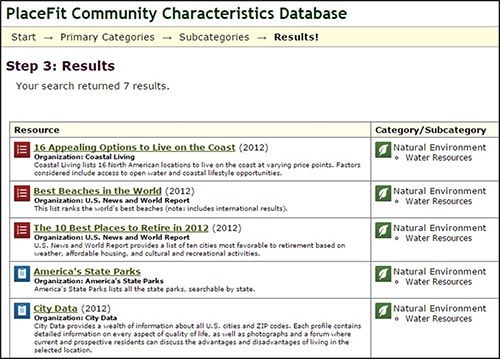
This sample results page from PlaceFit shows the lists and survey data that appear when a user selects the “Natural Environment” category and “Water Resources” subcategory. (Courtesy of
FHWA)
The Federal Highway Administration (FHWA) Office of Planning, Environment, and Realty recently launched two online tools that can provide useful information about livability activities related to transportation, land use, and community planning. These tools present resources that identify livability-related indicators, such as natural resources, aesthetics and scenery, and geography and climate. Together, the PlaceFit Community Characteristics Database (PlaceFit) and the Community Vision Metrics Web Tool (CVM) provide practitioners with livability resources that are relevant to their circumstances, communities, and quality-of-life goals.
PlaceFit Primary Characteristics
Architecture and Neighborhood
Atmosphere
Density and Demographics
Economics
Education
Geography and Climate
Health and Well-Being
Housing
Local Government and Political Culture
Natural Environment
Recreation and Entertainment Safety
Sociocultural
Transportation
PlaceFit Organizes Livability Resources into User-Friendly Database
PlaceFit provides access to a variety of existing resources that have been collected, ranked, rated, and organized regarding particular livability characteristics. These resources include lists compiled by news outlets like Forbes, MSN, National Geographic, and U.S. News & World Report; and by organizations such as AARP, the National Gardening Association, the National Park Service, the U.S. Environmental Protection Agency (EPA), and the U.S. Fish and Wildlife Service. These lists consider a wide variety of livability characteristics that are aggregated to suggest broader livability goals such as the best places to live, the healthiest cities, the greenest cities, and the best cities for outdoor activities.
To start, PlaceFit users select the top characteristics of interest to them from a list of 13 primary categories. Once they have selected one or more primary categories, they will be prompted to refine their search by selecting any number of subcategories. For instance, a user who selects the primary category “Natural Environment” will be prompted to select one or more of the following subcategories: “Green Living, Conservation, and Energy Use,” “Air and Water Quality,” “Scenic Qualities,” “Water Resources,” and “Wildlife.” Users can also choose to receive “Rankings” and/or “Data/Survey” results. The results include a list of links to rankings and data or surveys that meet the selected criteria.
PlaceFit was developed with input from over 25 non-governmental organizations, including the AARP Public Policy Institute, Keep America Beautiful, the Meals on Wheels Association of America, the Center for Neighborhood Technology, and the Congress for the New Urbanism. Constituents from these organizations suggested resources that they found valuable for better understanding education, health, well-being, recreation, entertainment, and transportation. This feedback was incorporated into the tool.
CVM Suggests Performance Metrics for Planners and their Communities
The CVM enables practitioners to search for performance indicators relevant to their specific circumstances, communities, and quality-of-life goals. The CVM covers a wide range of topic areas—from aesthetics to land use, public health, safety, housing, and mobility—which encourage the user to engage with various settings and disciplines. This tool can help practitioners identify livability-related indicators that align with their community’s vision and goals and lead them toward a measurable vision for their communities.
CVM Topic Areas
Accessibility
Aesthetics and Sensory
Community Amenities
Community Engagement
Economic
Housing
Land Use
Mobility
Natural Resources
Public Health
Safety
Sociocultural
Users select one topic area that is of interest to them and are then prompted to choose specific criteria within the category. This results in a list of suggested performance metrics that practitioners can use to determine how their community is performing within a given area. For example, a user who selects “Natural Resources” as the area of interest will be prompted to then select the geographic scale, setting/density, and transportation mode at which they would like to measure natural resources. The final results include a list of suggested metrics that practitioners can use to objectively measure the quality of various aspects of natural resources in their community.
The CVM also provides a tutorial that explains how users can choose the best qualitative and quantitative measures for outcomes related to the planning process. The tutorial suggests using the tool during the visioning stage so that goals can be grounded in tangible performance measures which drive the selection of plan projects and policies which will deliver results. This allows planners to track metrics over time to see how various plans have influenced community characteristics and behaviors.
While the CVM is a relatively new FHWA offering, the tool was beta-tested in Fayetteville, North Carolina in 2012. Local stakeholders and planners used the CVM during a multi-day charrette that was organized to discuss the Bragg Boulevard Corridor Plan. Bragg Boulevard is part of a network of major and minor streets connecting downtown Fayetteville with Fort Bragg U.S. Army Base. The Bragg Boulevard Corridor Plan presented a concept for the transformation of Bragg Boulevard into a multimodal corridor that improves mobility, accessibility, and prosperity in the corridor. Charrette participants organized themselves into small groups where they selected a specific concept of success for the corridor and drafted supporting goal statements for each concept. The groups then used the CVM to recommend up to ten performance measures under each goal statement. The session resulted in eight goal statements for the Bragg Boulevard Corridor Plan.
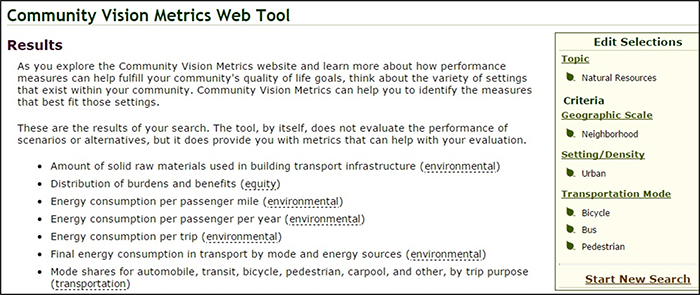
This sample results page from CVM shows the suggested metrics when a user selects the “Natural Resources” category for measuring bicycle, bus, and pedestrian modes in an urban neighborhood. (Courtesy of FHWA)
| Corridor Goal |
Performance Measures |
| Promote multimodal transportation choices, including travel by bus, bike, and foot |
- Miles of sidewalks
- Percent presence of crosswalks
- Frequency of transit service
- Transit ridership
- Miles of bike lanes
- Dollar investment in pedestrian facilities
- Percent of transportation users using non-single-occupancy vehicle modes (mode shares)
|
| Improve mobility while offering more efficient access to corridor destinations |
- Travel times (e.g. from Fort Bragg to downtown Fayetteville)
- Crash rate
- Number of traffic signals per mile
- Level of service
- Number of driveways per mile
|
| Improve the safety and visual character of Bragg Boulevard |
- Percent or miles of utilities buried
- Setback of buildings from curb
- Number of crashes involving utilities or poles
- Percent of utilities outages during inclement weather
|
This table includes three of the eight corridor goals identified during the Bragg Boulevard Corridor Plan charrette. Participants used the CVM to identify the corresponding performance measures listed here. (Courtesy of North Carolina State University)
In 2014, the Georgia Institute of Technology and North Carolina State University hosted workshops on performance measures that could be used as part of a transportation or comprehensive planning process. CVM was a focal point of the workshops, which were held in five different localities in the Southeast. As outlined in the Livability Performance Measures to Transportation Plans and Projects report, workshop hosts utilized the tool to identify context-specific livability performance measures. The report, which is a summary of the workshop findings, also said that participants found the tool useful for identifying potential livability measures.
Tools Encourage Livability-Focused Planning from the Start
These tools represent the beginning stage of a larger planning process. They both organize livability-related resources and information into a user-friendly searchable interface so practitioners can use independently or as part of a larger stakeholder involvement process. Users can choose when to use the tools to identify, implement, and track performance measures or community characteristics, but they will experience the greatest benefits if they apply the tools from the beginning of the planning/visioning process.
PlaceFit and CVM can be found on the FHWA Livability Initiative website, which provides fact sheets, tutorials, tools, and case studies. In addition, the Partnership for Sustainable Communities (PSC) has compiled a list of tools to help communities assess, plan, and design sustainable communities. These tools cover a broad range of topics, including community design and planning, transportation and housing, and the environment. The list includes tools developed by the PSC partner agencies—the U.S. Department of Housing and Urban Development, the U.S. Department of Transportation, and the EPA—as well as other Federal agencies and non-governmental organizations.
Contact Information
Shana Baker
Team Leader
Office of Human Environment
Federal Highway Administration
(202) 366-4649
Shana.Baker@dot.gov
Do you know of a great project
that we should feature?
Successes in Stewardship is a Federal Highway Administration newsletter highlighting current environmental streamlining and stewardship practices from around the country. Click here to subscribe, or call (617) 494-3719 for more information.

