Roadside Revegetation: An Integrated Approach to Establishing Native Plants and Pollinator Habitat
CHAPTER 3 – Planning
Table of Contents
3.1 INTRODUCTION
Careful planning is essential to the success of any roadside revegetation project. There are a series of steps that are important to consider in developing a comprehensive revegetation plan. These are shown in Table 3-1 and outlined in this chapter.
Table 3-1 | Planning Phase Steps
|
Activity
|
Definition
|
|
Defining revegetation objectives
|
Description of the general purpose and goals of the road project as determined by societal, ecological, and transportation needs, environmental regulations, and other factors.
Development of revegetation objectives, including pollinator habitat enhancement, erosion control, water quality enhancement, weed control, and carbon sequestration.
|
|
Gathering pre-field information
|
Prior to field surveys, the review of reports and websites that describe soils, vegetation, climate, and pollinators for the project area.
|
|
Defining revegetation units
|
Classification of areas within the project site that are similar enough to be appropriate for similar strategies and treatments. Homogenous sites will have only a few units; sites with greater diversity (different soil types, microclimates, vegetation types, and management needs) will have more revegetation units.
Each revegetation unit is distinct in terms of ecology, management requirements, or both.
|
|
Identifying reference sites
|
Location of natural or revegetated areas that will serve as models for desirable recovery of native plant communities and pollinator habitat. One or more reference sites are identified for each revegetation unit in the project area.
|
|
Gathering field information
|
Survey of reference sites, as well as the road project area, for vegetation, soils, climate, and pollinator habitat that will provide baseline ecological data for developing the revegetation plan.
|
|
Defining the desired future condition (DFC) target
|
Creation of specific, measurable goals for each revegetation unit, usually defined in terms of the percentage of vegetative cover, ground cover, species composition, plant growth, plant density, and pollinator diversity and abundance.
|
|
Identifying limiting factors to plant establishment
|
Review of pre-field and field information to determine which site factors may be limiting for plant growth based on water input, water storage, water loss, nutrient cycling, surface stability and slope stability.
|
|
Identifying factors that affect pollinators
|
Review of pre-field and field information to identify the limiting factors affecting pollinators. These include nectar and pollen sources, breeding habitat, water sources, shelter, landscape connectivity, nesting habitat, and vegetation management.
|
|
Inventory of site resources
|
Assessing physical resources that may be available or generated for use in the revegetation plan. These resources include topsoil, duff, litter, woody materials, logs, and plant materials
|
|
Developing a vegetation management strategy
|
A maintenance strategy is developed to assess how the revegetation project will affect the management and maintenance of the roadside after the road project has been completed and integrate this into the revegetation plan. Ideally, the planning team or designer meets with local maintenance personnel, to learn what problems can be expected in reestablishing roadsides with native plants.
|
|
Selecting site improvement treatments
|
The treatments that will improve the site for plant growth or pollinator enhancement are selected.
|
|
Selecting plant species for propagation
|
Native plant species that will be used on the project are selected based on project objectives and how well they will perform on the site. Genetic diversity and local adaptation is considered in the reproductive sources that will be used to propagate the plant materials.
|
|
Selecting plant establishment methods
|
Optimal propagation methods are determined for each plant species. These include the plant materials that will be produced (seeds, cuttings, plants), the method of plant material installation, and when to install the plant materials (seeding and planting windows).
|
|
Developing a revegetation plan
|
A written revegetation plan captures the most important information and decisions that were made on revegetating the project site. It typically outlines project objectives, revegetation units, treatments, plant species, planting methods, roles, responsibilities, timelines, and budget.
|
Back to top
3.2 DEFINING REVEGETATION OBJECTIVES
The design objectives of a road project guide the development of the revegetation plan. As discussed in Chapter 2, road objectives usually involve goals of improving safety and efficiency, as well as environmental health. Revegetation objectives develop from road objectives and become the foundation of the revegetation and monitoring plans. It is important to develop a clear set of revegetation objectives early in the planning phase. When these objectives are understood and expectations are clear, the development and implementation of a revegetation plan are easier and more successful. Most roadside revegetation projects share the common objective of initiating and/or accelerating the process of natural succession near the roadside in order to establish self-sustaining native plant communities (Brown and Amacher 1999; Clewell et al 2005). This objective usually reflects larger project goals, stated in terms of increasing pollinator habitat, protecting soil and water resources, carbon sequestration, enhancing roadside aesthetics, limiting invasive plants, and improving road safety and function while protecting environmental health. Later in the planning process, revegetation objectives are used to develop specific goals (stated as DFC targets) for evaluating the success of the revegetation work. Table 3-2 defines some terms commonly used in defining revegetation objectives. Clarifying whether the overall goal is reclamation or resto- ration, for example, is an essential distinction for defining revegetation objectives.
Table 3-2 | Terms used in defining revegetation objectives
| TERM |
DEFINITION |
|
Revegetation
|
To reestablish vegetation on a disturbed site. This is a general term that may refer to restoration, reclamation, and rehabilitation.
|
|
Restoration
|
This is the re-creation of the structure and function of the plant community identical to that which existed before disturbance. The goal of restoration is conservation, with the intention of maximizing biodiversity and functioning.
|
|
Reclamation
|
This is the re-creation of a site that is designed to be habitable for the same or similar species that existed prior to disturbance. Reclamation differs from restoration in that species diversity is lower and projects do not re-create identical structure and function to that before disturbance. However, a goal of long-term stability with minimum input is implied.
|
|
Rehabilitation
|
This process creates alternative ecosystems that have a different structure and function from the pre-disturbance community, such as a park, pasture, or silvicultural planting.
|
Adapted from Allen et al 1997
Table 3-3 illustrates some of the most common road-related revegetation objectives as they relate to the road design goals. Most revegetation projects state several objectives to address both short-term and long-term outcomes. For example, short-term, immediate revegetation objectives on most projects include erosion control and water quality protection through mulch and vegetative cover. A long-term revegetation objective would be to establish a native plant community, with a range of plant species that benefit pollinators by increasing foraging, breeding, and nesting habitats. Table 3-4 outlines roadside objectives specific to enhancing pollinator habitat. While short-term objectives might rely on quick-growing ground covers such as grasses and forbs, long-term objectives are often broadened to include such revegetation treatments as planting deep-rooted tree and shrub seedlings to stabilize roadsides, creating visual screens of road infrastructure, and/or supporting sustained native plant community development.
Table 3-3 | Native plants are used to meet road and revegetation objectives
| REVEGETATION OBJECTIVE |
FUNCTION OF NATIVE PLANTS |
|
Pollinator habitat enhancement
|
An important revegetation objective is to improve pollinator habitat by selecting a mix of plant species and site improvements that encourage foraging, breeding, nesting, and overwintering of a variety of pollinator species (Table 3-4).
|
|
Erosion control
|
Controlling surface erosion and thereby protecting soil and water quality is a high priority on road construction projects. Native grasses, forbs, and other herbaceous plants can help meet this challenge, particularly when they are accompanied by appropriate mulching treatments. Deep-rooted native trees and shrubs can also enhance stability of cut and fill slopes.
|
|
Water retention
|
Runoff from road surfaces and cut slopes concentrate water into ditches during rainstorm events, increasing the amount of water that normally enters natural drainage ways. Practices that use native plants in the design, such as constructed wetlands and bioretention swales, amended ditches and fills, filter strips, can help retain much of this water on the project site, reducing the amount of sediments and road pollutants from entering stream courses. The additional water increases the productivity of the established plants.
|
|
Weed control
|
Roadsides can be corridors for the transport and establishment of noxious or invasive weed species. Once established, weeds are hard to eradicate and become seed sources for further encroachment. Revegetating with desirable native species minimizes opportunities for problem species to establish.
|
|
Carbon sequestration
|
Roadside revegetation with native plants can help improve air quality and the health of the public and environment by plants taking in and reducing the amount of carbon dioxide in the atmosphere. Plants store the carbon in the soil long-term and release beneficial oxygen. Native roadside vegetation typically requires less mowing maintenance, herbicides and pesticides, which reduces carbon in the atmosphere and reduces maintenance costs and associated emissions.
|
|
Visual enhancement
|
Vegetation is often used to enhance the aesthetic experience of the traveler. Wildflowers add color and beauty throughout the growing season; deciduous trees provide shade, vertical structure, and change color in fall; and evergreen species stay green all year, adding visual interest, structure, and green color all year. Vegetation can also be used to frame views, soften views or hide structures such as gabion walls or slopes covered by riprap.
|
|
Wildlife enhancement
|
Many roads intercept animal corridors. Designing native plantings into animal underpasses or overpasses can make roads more permeable to wildlife. The presence of birds and small animals can be enhanced when appropriate plant species are reestablished.
|
|
Cost management
|
Advanced planning, an integrated approach, and the use of appropriate stocktypes and equipment all facilitate successful and cost-effective revegetation.
|
Table 3-4 | Roadside objectives for enhancing pollinator habitat
Roadsides planted with native plants also can provide pollinators with shelter, sites for nesting or egg-laying, and overwintering habitat. Pollinators have complex life cycles, with different needs at different stages of their lives. Roadsides can provide resources for a portion of the life cycle of some species, while providing resources needed for the entire life cycle of other species.
| Pollinators |
Food |
Shelter |
Revegetation Goals |
|
Bats (nectar feeding species)
|
Nectar, pollen, fruit
|
Caves and mines
|
|
|
Bees: Bumble
|
Nectar for adults; nectar and pollen collected as provisions for larvae
|
Nest in small cavities, underground in abandoned rodent nests, under clumps of grass, or in hollow trees, bird nests, or walls
|
- Increase density and diversity of native flowering plants
- Provide native bunch grasses for bumble bee nesting habitat
- Provide areas with partially vegetated well-drained soil
- Provide living and dead pithy and woody vegetation
|
|
Bees: Ground- nesting
|
Nectar for adults; nectar and pollen collected as provisions for larvae
|
Nest in bare or partially vegetated, well-drained soil
|
|
|
Bees:
Tunnel-nesting
|
Nectar for adults; nectar and pollen collected as provisions for larvae
|
Nest in narrow tunnels in dead standing trees, or excavate nests in pith of stems and twigs. Some construct domed nests of mud, plant resins, saps, or gums on the surface of rocks or trees
|
|
|
Beetles
|
Pollen and nectar as adults; vegetation or prey such as aphids, slugs, insect eggs, as larvae or adults
|
Larvae overwinter in loose soil or leaf litter; Adults shelter under rocks, logs, brush
|
- Increase density and diversity of native flowering plants
- Provide refuge from burning and grazing during dormant season and early spring
|
|
Butterflies/moths: Caterpillar
|
Leaves of larval host plants
|
Host plants
|
- Increase density and diversity of native flowering plants
- Include host plants
- Provide refuge from burning and grazing during dormant season and early spring
|
|
Butterflies/moths: Adult
|
Nectar; some males obtain nutrients, minerals, and salt from rotting fruit, tree sap, animal dung and urine, carrion, clay deposits, and mud puddles
|
Protected site such as a tree, bush, tall grass, or a pile of leaves, sticks, or rocks
|
|
|
Flies
|
Nectar and sometimes pollen as adults; insect prey such as aphids, scales, mites, thrips
|
Larvae found on plants near prey; pupae and adults overwinter in soil or leaf litter
|
- Increase density and diversity of native flowering plants
- Provide refuge from burning and grazing during dormant season and early spring
|
|
Hummingbirds
|
Nectar, insects, tree sap, spiders, caterpillars, aphids, insect eggs,
and willow catkins
|
Trees, shrubs, and vines; typically need red, deep- throated flowers, such as twin berry or penstemons
|
- Increase density and diversity of native flowering plants, particularly species with deep throats
|
|
Wasps
|
Nectar as adults; insect prey such as caterpillars, aphids, grasshoppers, planthoppers, and
true bugs as larvae
|
Many nest in the ground; others nest in tunnel nests in wood or cavities in mud or resin
|
- Increase density and diversity of native flowering plants
- Provide areas with partially vegetated well-drained soil
- Provide living and dead pithy and woody vegetation
|
Revegetation objectives are often developed by the designer and design team and are supported by, or integrated with, public documents such as Environmental Assessments or Environmental Impact Statements. The objectives sometimes originate from a state or federal agency and motivated by environmental concerns and regulations regarding water quality, erosion control, and vegetation establishment. In the early stages of planning, revegetation objectives are broad and general. As the project evolves, objectives are translated into more precise and measurable goals (DFC targets). After the installation is complete, DFC targets and revegetation objectives will be used to monitor, evaluate, and manage the project.
Back to top
3.3 GATHERING PRE-FIELD INFORMATION
The revegetation plan is developed by obtaining an understanding of the road design and by gathering pre-field information on the soil, climate, vegetation, and pollinators of the project site. Much of this information can be obtained prior to visiting the project site. A good pre-field review of information can make the time in the field more efficient and effective.
3.3.1 CLIMATE PRE-FIELD ASSESSMENT
Local climate plays a dominant role in the success or failure of the revegetation effort. Knowledge of local climate factors, including historic climate data and recent trends, can inform the designer and help delineate the appropriate revegetation units and develop achievable DFC targets. In later phases of the planning process, climate data will be used to determine appropriate revegetation treatments.
Inset 3-1 | Climate change
Climate change effects, including increased frequency of extreme weather events, wildfires, invasive species, drought, increased temperatures, and altered stream flows, can affect native plants and revegetation success on both temporal and spatial scales. Measurable effects of climate change have been observed such as spring events arriving earlier, shifts in species distribution, and disruption of plant-pollinator dynamics. Parmesan and Yohe (2003) showed spring events such as budburst in plants, the arrival of migratory birds and butterflies, bird nesting, and others occurred an average of 2.3 days earlier per decade over 123 years. This same review revealed that the latitudinal and elevational range limits of several alpine plant populations had shifted northward 3.79 miles and upward approximately 20 feet per decade over the past 1,000 years. As a result of these effects of climate change plants, in particular long-lived perennials, are forced to either adapt or migrate (Parmesan 2006).
The migration of plants or changes in plant phenological events have been observed to disrupt or decouple pollinating insect interactions with their host plants. For example, host plants may senesce more quickly than caterpillars develop and other asynchronies between butterflies and their host plants (Parmesan 2007). Some species of pollinators have undergone range contractions due to climate change (Kerr and others 2015). Limitations of dispersal and establishment may mean that many species of pollinators will not be able to keep up with predicted climate change scenarios and that climate change will exacerbate other threats to pollinators, including habitat loss (Settele and others 2016).
Obtaining climate records from a variety of sources is the first step in conducting a climate assessment. There are many sources of climate records for the United States (Figure 3-1). One source is the Western Regional Climate Center website that displays the location of the National Oceanic and Atmospheric Administration (NOAA) Cooperative Stations in the United States and provides historical weather data for most stations. Each weather station has helpful graphics, such as spring and fall “freeze probabilities” (Figure 3-2) that can be used to determine the best dates for sowing seeds and planting seedlings. Another available graphic is the probability of precipitation throughout the year, which can be used to determine if supplemental irrigation is necessary (Figure 3-3).
|
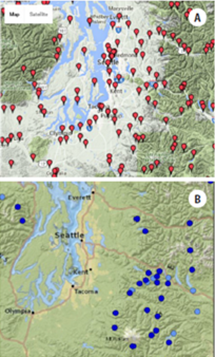
Figure 3-1 | NOAA and NRCS weather stations - The United States has an extensive system of weather stations maintained by National Oceanic and Atmospheric Administration (NOAA) and Natural Resources Conservation Services (NRCS). These maps show the locations of weather stations in the Puget Sound area. Stations administered by NOAA are shown on the left (A) and those by NRCS on the right (B). Historic climate summaries and interpretative graphs for each station can be downloaded from each website.
|
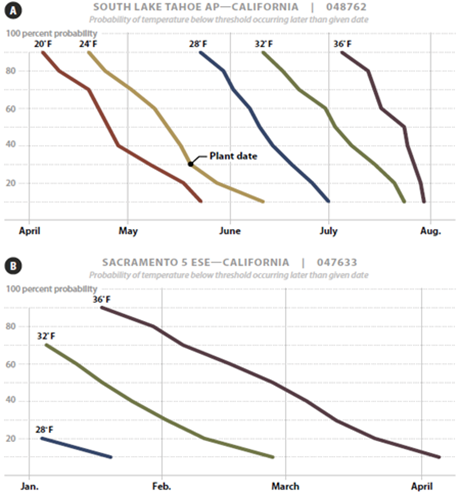
Figure 3-2 | Spring and fall freeze probability graphs - In addition to historic weather station data, the Western Regional Climate Center has many useful graphs (located on the left-hand side of the weather station data screen), such as the “Spring and Fall Freeze Probability” curves. The graph on the left shows the probability of temperatures dropping to sub-freezing temperatures during the winter through summer in South Lake Tahoe, California. At this site, planting might be planned when there is less than a 30-percent probability that temperatures will drop below 24° F to reduce the risk of seedling damage as the plants are coming out of dormancy. This would put the planting date sometime around the middle of May. In contrast, Sacramento, California, to the west and near sea level has a very different climate as shown in the lower left-hand graph. According to these curves, it is improbable that temperatures ever reach 24° F in winter and spring; therefore, plants could be installed at any time during the winter.
Finding a weather station closest to the project site will be helpful in understanding the influence climate will have on the project. The PRISM website allows the user to locate the project site on a map of the United States, so instead of using data from a single weather station located miles away from the project, this website creates a weather profile specific to the project site. It does this by extrapolating data from surrounding weather stations using a digital elevation model and expert knowledge of complex climatic patterns. This website also displays weather trends and anomalies (e.g., extreme heat) that can be helpful in planning (Figure 3-4). NRCS maintains the National Weather and Climate website that reports historic and real-time weather data from automatic weather stations located in remote mountainous areas of the western United States. If a project is located near one of these stations, then it is easy to monitor current weather conditions. Historic data and more recent climate trends can be a valuable tool for the designer to consider when developing a revegetation plan. Recent studies of climate trends have noted changes that are affecting pollinators and their habitat and have offered recommendations on how designers can adapt revegetation plans to these changing conditions.
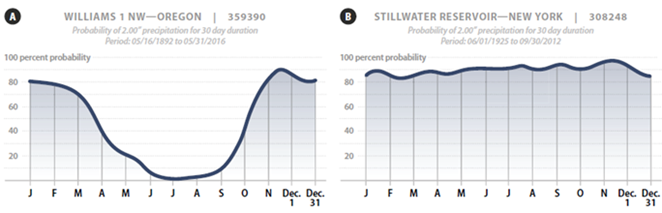
Figure 3-3 | Rainfall probability graphs - Another helpful graph from the Western Regional Climate Center displays the probability of receiving precipitation through the year. The probability of receiving 2 inches of rainfall in a 30-day period for a station in southwestern Oregon (A) indicates that it is highly unlikely this will ever happen during the summer, which may lead the practitioner to consider supplemental watering or some other measure to keep plants alive during the first year after the seedlings are planted. In comparison, the probability that 2 inches of precipitation would occur in 30 days in upstate New York (B) any time of the year is more than 90 percent, indicating that irrigation of newly planted seedlings may not be necessary.
Source: Western Regional Climate Center
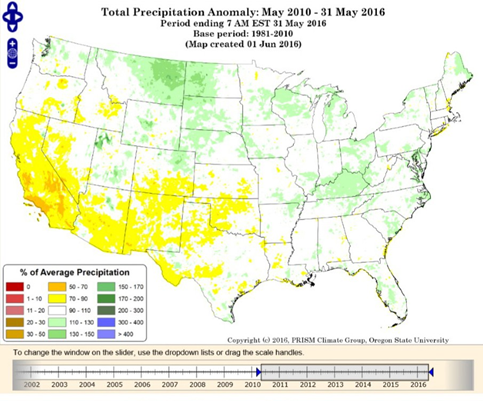
Figure 3-4 | Precipitation trends - The PRISM website allows the user to obtain extrapolated weather data for any point in the United States. By identifying the project location on an interactive map of the U.S., a report is generated that summarizes site-specific climate information for that area. In addition, this website displays climate information in a variety of ways that may be helpful in revegetation planning. This map, for instance, shows precipitation trends for the past five years across the U.S., which can be useful during the development of the revegetation plan.
Planning for Climate Change
Climate change effects, including increased frequency of extreme weather events, wildfires, invasive species, drought, increased temperatures, and altered stream flows, can affect native plants and revegetation success on both temporal and spatial scales. Measurable effects of climate change have been observed such as spring events arriving earlier, shifts in species distribution, and disruption of plant-pollinator dynamics. Parmesan and Yohe (2003) showed spring events such as budburst in plants, the arrival of migratory birds and butterflies, bird nesting, et al occurred an average of 2.3 days earlier per decade over 123 years. This same review revealed that the latitudinal and elevational range limits of several alpine plant populations had shifted northward 3.79 miles and upward approximately 20 feet per decade over the past 1,000 years. As a result of these effects of climate change plants, in particular long-lived perennials, are forced to either adapt or migrate (Parmesan 2006).
The migration of plants or changes in plant phenological events have been observed to disrupt or decouple pollinating insect interactions with their host plants. For example, host plants may senesce more quickly than caterpillars develop and other asynchronies between butterflies and their host plants (Parmesan 2007). Some species of pollinators have undergone range contractions due to climate change (Kerr et al 2015). Limitations of dispersal and establishment may mean that many species of pollinators will not be able to keep up with predicted climate change scenarios and that climate change will exacerbate other threats to pollinators, including habitat loss (Settele et al 2016).
For the Designer
The development of climate change decision support tools and their application to revegetation practices is rapidly evolving and generally beyond the scope of this manual. Designers may consult geneticists and other experts for the most current guidance and best management practices for their specific project goals and site conditions. Resiliency, diversity, and adaptability will remain important strategies for both short- and long-term revegetation success (Havens and others 2015). Monitoring will also be critically important for informing and adjusting revegetation practices in a changing climate.
Revegetation project designers have an opportunity to address many of these effects of climate change during all phases of their projects. Doing so can increase the overall robustness and health of restorative plant populations, thereby increasing the success of projects. Ways in which designers might address climate change in their revegetation projects include the following.
Diversifying Plant and Seed Sources
Revegetation efforts often occur where previously intact habitats have been disrupted or fragmented. If the area of disturbance is small, such as a localized landslide, the fragmentation might be minimal. It is often the case in roadside revegetation projects however, that the disruption to the original habitat can span miles and remain in place for decades. With these projects the original habitat has often been bisected, the hydrology disrupted, and the area might have experienced multiple disturbances or uses over time. In these instances, it’s often valuable to collect plant materials along the entire length of the project area, including reference and adjacent sites, within each provisional seed zone.
Observations of, and collections from, mosaic populations of similar aged plants of the same species often provide opportunities to capture pre-disturbance genetic diversity and mimic natural gene flow patterns. Collecting and sourcing plant material in the direction of climate change conditions (i.e., up the elevation or latitudinal gradient) can potentially incorporate traits needed to compensate for predicted changes due to climate (Breed et al 2013). The Seedlot Selection Tool (SST) is a new mapping application that can assist designers in considering options for obtaining seed and matching seed sources to planting sites based on climatic information. The climates of the planting sites can be chosen to represent current climates, or future climates based on selected climate change scenarios. SST can also be used to identify planting sites that are appropriate for a particular seed source, now and into the future.
Utilizing a Mix of Annual and Perennial Species to Meet Short- and Long-term Goals
There is often a desire to provide quick green up and stabilization to projects with annual plant species. Benefits of annual plants include quick germination and establishment, their seeds can be relatively inexpensive, and they are abundant in the current market. Disadvantages of annual species include the fact that they are short-lived, are often seeded in monocultures, their parental lineage and nativity may be difficult to ascertain, and they can out-compete perennial seeds. Importantly, in the context of climate change, using only annual species does not create a resilient plant community with long term persistence.
At times designers and managers can become frustrated at the slow germination and establishment of perennial seeds. Perennial plants tend to establish deeper, persistent roots and therefore provide longer lasting stabilization than do annual plants however. Native perennials are often seeded in a mixture of grasses and flowering forbs, a practice not impossible with annuals but one that seems underutilized. Due to their outcrossing, one disadvantage of long-lived perennial plants tend to be more susceptible to fitness impacts of inbreeding (Breed et al. 2013).
Developing seed mixes that contain both native annual and perennial seeds, proportional to what is appropriate for the individual project in order to avoid deleterious effects of competition and to mimic the vegetation of the surrounding environs, can exploit the best traits of each while minimizing risks.
Developing Monitoring Plans with Climate Change in Mind
Regular assessments of plant survival and recruitment will assist designers and managers in understanding potential effects of climate change on revegetation success and outcomes. To facilitate adaptive management, keep detailed records on plant material sources, the planting scheme (e.g., seeding prescription or seedling numbers and density by species), and site preparation and seeding/planting methods. A clear summary in the monitoring report (Section 6.6) can help ensure this information is available to designers in the future.
Some projects, in particular those that involve wetland construction or enhancement, have monitoring plans ten years into the future or more. Given that plant responses to climate change trend toward upward or northward migration, stratified monitoring may be appropriate for some projects. Designers can stratify monitoring units by elevation band, latitudes, degree days, etc. in an effort to identify any changes in plant communities early. Including adaptive management strategies within the monitoring plan will help identify possible solutions to trends that are learned from monitoring.
3.3.2 SOILS
More than 95 percent of the counties in the United States have soil surveys either completed or in the process of completion by Natural Resources Conservation Services (NRCS). Information from these surveys is available on the Web Soil Survey website. By delineating the road project area on the Web Soil Survey map, a customized soils report specific to the project area is generated (Figure 3-5). Included in the report are profile descriptions, characteristics, and capabilities for each soil mapping unit. A typical profile description is provided and includes topsoil depth, soil textures, rock content, soil depth, available water holding capacity, permeability rates, and drainage classes. More detailed information on each soil series, such as laboratory results for nutrients, water retention curves, and other soil properties, is available at the NRCS National Cooperative Soil Survey Soil Characterization Data website.
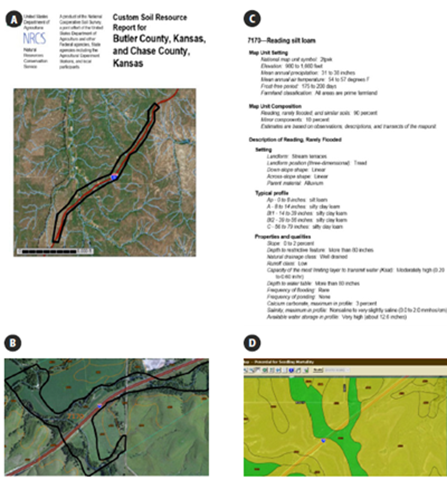
Figure 3-5 | Soils maps generated from the Web Soil Survey website - The Web Soil Survey can be used to develop a custom soils report for most highway projects in the U.S. In this example, a 10-mile stretch of road is being proposed for reconstruction through several counties in Kansas. To understand the soils, the study area is delineated on the Web Soil Survey Interactive Map of the U. S. which generates a site-specific soil report (A). Within the report is a map of the project area with the locations of each soil mapping unit. For each mapping unit, the report describes the soil profile and soil characteristics (C). In this example, a prominent soil mapping unit in the planning area is “7170—Reading silt loam” (B). It is a deep stream terrace soil described in the report (C). The Web Soil Survey also allows the user to query the project site for areas of similar land capabilities or limitations. For this project site, one of the maps generated was areas where high seedling mortalities may be expected (D). Grouping of soil mapping units can also be used in the development of revegetation units.
The information generated from these reports is for undisturbed soils, therefore the use of this information needs to be adapted to the type of disturbance expected to occur within the project. For example, on a project where topsoil is to be removed, it can be assumed that the soil remaining after construction will be the subsoil and not topsoil. The designer would consider the characteristics of the subsoil (B horizon) described in the Web Soil Survey report rather than the topsoil. If the topsoil is to be salvaged, the Web Soil Survey report can provide a general characterization of the topsoil that will be removed. It can also give a good description of an undisturbed reference site soil which may be helpful if restoration of the original site is the objective.
In addition, the Soil Data Explorer portion of the website creates a series of maps based on soil interpretations. Depending on the county the survey was conducted in, a wide range of maps are available, including suitability for hand planting, potential for seedling mortality, forest and range productivity, soil pH, hydrologic soil groups, depth to restrictive layers, and more.
Most lands administered by the USDA Forest Service have separate soils reports in addition to, or in lieu of, the NRCS soils report. These reports are often referred to as a Soil Resource Inventory report and can be obtained at the Forest Service District Office. The agency also maintains a national inventory and mapping ARC-GIS application that includes a soil database as well as information on geology, potential natural vegetation, and Terrestrial Ecological Units Inventory (TEUI)
3.3.3 VEGETATION PRE-FIELD ASSESSMENT
Ecoregions and Seed Zones
Ecoregions are defined areas in North America that have similar geographic, vegetative, hydrologic, and climatic characteristics. Several ecoregion systems are available; however, for the purposes of this publication, the ecosystem maps developed by the U.S. Environmental Protection Agency are used. The United States is divided into four ecoregion levels, each level representing increasing degrees of detail:
- Level I—12 broad ecoregions
- Level II—25 ecoregions
- Level III—105 ecoregions
- Level IV—967 ecoregions
Because ecoregion maps identify areas with similar environmental characteristics, they are useful in planning, monitoring, information sharing, and management. The Level III ecoregion map has also been used to provide recommendations for seed use and movement of species and geographic areas where empirical genetic information is lacking (Bower et al 2014). Used in conjunction with climate data, such as minimum winter temperature and aridity, Level III ecoregions are a good starting point for guiding source selection of revegetation species. See Chapter 5 for a more detailed discussion of seed zones and seed transfer guidelines.
Ecoregional Revegetation Application (ERA)
A spatially explicit online planning tool called the Ecoregional Revegetation Application (ERA) has been developed by the FHWA that will list the recommended workhorse and pollinator-friendly plant species for all EPA Level III ecoregions in the continental United States (Figure 3-6). The data used to create these lists were vetted by botanical experts and gathered from reliable sources such as the scientific literature, USDA PLANTS database, the USDA Agricultural Research Service pollinating insect unit, and the Xerces Society for Invertebrate Conservation. For each plant species, the ERA will provide attributes such as flowering season and preference for sun that will denote whether a given species is a workhorse (i.e., a reliable and available revegetation plant), or pollinator-friendly (e.g., supports larval or adult pollinators). For pollinator-friendly plant species the selector will denote which general groups of pollinators the plant species will benefit. Moreover, using data generated at the Chicago Botanic Garden (White et al 2016) the ERA will also indicate if a species of interest is commercially available. The first step in revegetation planning, specific to developing pollinator habitat, will be to use ERA to identify potential workhorse plant species for the project area. From this list, other plant species may be selected based on development of a site-specific pollinator working group (Section 3.13.1).
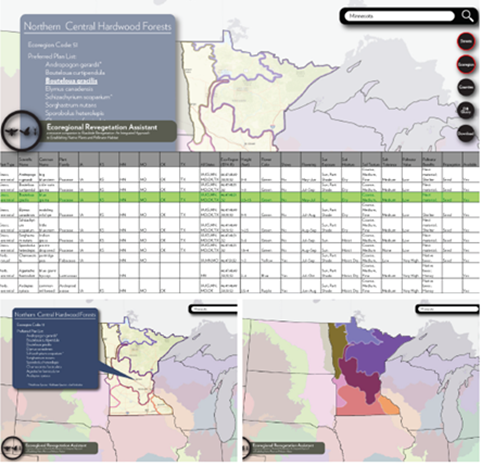
Figure 3-6 | ERA—An online planning tool to select workhorse and pollinator-friendly species - The Ecoregional Revegetation Application (ERA) allows the designer to obtain a list of appropriate workhorse and pollinator-friendly plant species for any location in the United States. Each workhorse species will display the plant attributes important for plant establishment and pollinator habitat enhancement. Please note that this image is a mockup of the future product and is displayed to demonstrate the concept of the online tool.
3.3.4 POLLINATORS PRE-FIELD ASSESSMENT
During the early stages of planning, it is import- ant to identify “at-risk” pollinator species that may be affected by the project so that special measures can be taken to protect or enhance populations. A good source for identifying at-risk species is the Xerces Society Red Lists website. This site lists bees, butterflies, and moths that are at-risk by state. It also provides links to recovery plans for species listed under the Federal Endangered Species Act. Nature-Serve Explorer is a searchable database of plant and animal species in the U.S. that includes conservation status information. Other sources of information for at-risk pollinators are the wildlife and forestry departments of state and federal agencies.
Many good websites are devoted to pollinator species. The BAMONA (Butterflies and Moths of North America) (Figure 3-7) and eButterfly websites are citizen scientist websites that provide access to data about butterflies and moths in North America. Sightings of butterfly and moth species are shown on maps of the U.S. for many species on these websites, including a description of each species. These maps allow the designer to determine if specific pollinator species are near the project area. The crowd-sourcing website, BugGuide, is an online citizen science group that collects images of North American insects and offers an insect identification service for submitted images. Specific to the monarch butterfly is the Monarch Joint Venture website. This is a good resource for monarch butterfly biology, and the site also presents a map that displays current monarch butterfly sightings throughout the United States.
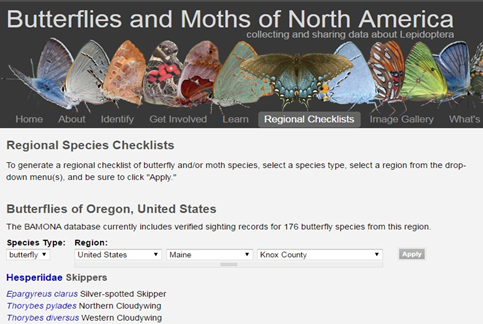
Figure 3-7 | BAMONA website displays pollinator sightings for locations around the US
3.3.5 ROAD PLANS
Understanding the design of the road project and how the site will appear after construction are important in developing a revegetation plan. Prior to a field review, consider conducting an evaluation of road plans and reports. Road plans show road cuts, road fills, drainages, ditches, disposal areas, abandoned roads, and engineered structures, which typically require different revegetation strategies. As discussed in the next section, these road components often become the basis or foundation of the revegetation unit map. Most road plans include a series of cross sections that provide slope steepness and shape, components that directly guide revegetation design. Many road projects include Storm Water Pollution Prevention Plans (SWPPP) that describe how water will be controlled, directed, and treated. These reports address the needs and expectations for soil cover and revegetation and it is helpful to understand them prior to developing a revegetation plan. Refer to Section 2.4 for how to read road plans, profiles, cross-sections, and typical views.
Back to top
3.4 DEFINING REVEGETATION UNITS
Revegetation units are areas with similar revegetation treatments and environment (e.g., soils, climate, and vegetation potential). In mountainous terrain, there may be several revegetation areas in a mile of roadside due to changes in aspect, soil type, and road drainage. Roads in mid-western states, however, often have only one revegetation unit that may encompass much of a project area because of the uniformity of the landscape. The first step in developing a revegetation unit is grouping major soil types together with similar characteristics important for reestablishing native plant communities. For example, a project site with a group of soils that are less than a foot deep would have a different set of revegetation treatments than deeper soils and for that reason would be identified as a revegetation unit based on soil depth. Grouping soils into revegetation units can also be done on websites such as the BAMONA, which can display specific locations where pollinators have been sighted. The search for a specific county in Maine, for example, brings up a list of butterfly and moth sightings.
As described in Figure 3-5, a soils map and report are created on the Web Soil Survey by delineating the project area on the interactive map of the U.S. At the same time, a map can also be produced that groups soils by similar capabilities to create distinct plant communities called “ecological sites”. The ecological sites section of the Web Soil Survey also lists the major native species for each ecological site for many parts of the U.S.
Revegetation units also designate areas that have the same revegetation objective. For example, a road project may include a constructed wetland for maintaining or improving water quality. In another area, the objective may be to enhance pollinator habitat. These areas would be designated as separate revegetation units because they would have different revegetation treatments and species, which might include a pollinator species mix for the pollinator habitat unit and an erosion species mix for the wetland unit. In addition, soil improvement treatments for the wetland would be developed to enhance wetland species and maintain the proper functioning of a constructed wetland. This may include creating manufactured soil that is specific to wetland species and water filtration.
Road components also play a large role in delineating revegetation units. In mountainous terrain, cut slopes and fill slopes are often designated as separate revegetation units because of the differences in soil depth, slope gradient, and road drainage between the two slopes. Table 3-5 shows revegetation units commonly associated with the components of a road.
The revegetation plan includes a revegetation unit map that locates revegetation units on the road project map (Figure 3-8). The revegetation plan further describes the soils, climate, and vegetation of each revegetation unit and how the revegetation objectives will be met.
Table 3-5 | Common revegetation units often associated with road components
| Road Component |
Types of revegetation units |
|
Cut slopes |
Cutslopes, living snow fence, pollinator habitat |
|
Ditches |
Amended ditches, wetlands, biorention swales, bioswales |
| Shoulders |
Shoulders |
| Fill slopes |
Fill slopes, filter strips, amended fill slopes, wave-attenuating bioscreens, living snow fence, pollinator habitat |
| Culvert outlets |
Vegetated culvert outlets |
| Engineered slopes |
Reinforced soil slopes, vegetated MSE walls, bioengineered slopes |
|
Bridges |
Stream restoration terraces and slopes |
|
Disposal or staging areas |
Restored areas, pollinator habitat |
| Abandoned roads |
Restored obliterated road, pollinator habitat |
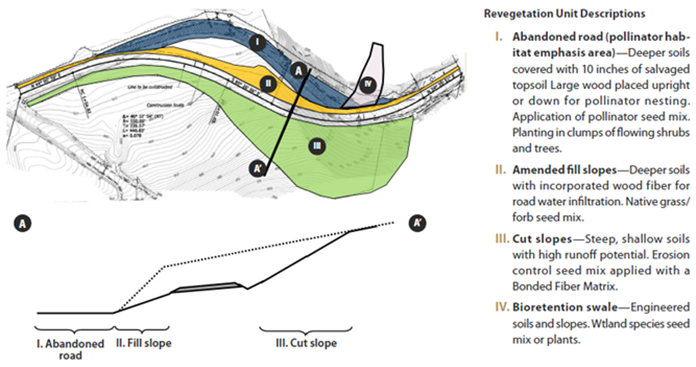
Figure 3-8 | Example—cut and fill slopes often define revegetation units - Major road components such as cut slopes, fill slopes and abandoned road sections often define revegetation units because of similar soils, objectives, and revegetation treatments. The road project in this example has four revegetation units that correspond to cut slopes, fill slopes, abandoned road, and bioretention swale. The objective for the road reconstruction project was to reduce existing curves for traffic safety while increasing pollinator habitat and decreasing the effects of road runoff and soil erosion on water quality. The road plans call for realigning the road, leaving an abandoned section of road, and greater area in cut slopes. During the planning phase, the revegetation units were identified based on soils and road objectives. Revegetation Unit I is the abandoned section of road to be restored by removing pavement, subsoiling the subbase, adding fill, and applying salvaged topsoil. Because the area is a pollinator habitat emphasis area, the seed mix will have more than 50 percent pollinator forb species. Flowering shrubs and trees will be planted in clumps. Salvaged logs from the road clearing operation will be randomly placed upright and on the ground for pollinator nesting habitat. Unit II includes fill slopes that will be amended with shredded wood to increase infiltration rates and capture and filtrate road surface runoff water. A low-growing native grass and forb seed mix will be applied. Unit III includes steep-cut slopes with high erosion potential that will be terraced and a seed mix primarily composed of grasses for erosion control will be applied in a bonded fiber matrix (BFM). Unit IV is a shallow draw where all road ditch water collects. It will be constructed as a bioretention swale to retain and filter sediments and road pollutants from the water before entering the stream. Wetland seedlings will be planted.
Back to top
3.5 IDENTIFYING REFERENCE SITES
Reference sites provide a natural model for possible vegetation outcomes and are important for defining DFC targets, as well as evaluating and monitoring the project following implementation (SER 2004). They can also be used to document the types and amounts of pollinator species that may be present in putatively natural environments near the project area.
Each revegetation unit can have at least one corresponding reference site that models the expected outcome or DFC target of the unit. Ideally the reference site shows how a revegetation unit might recover from disturbances at different points in time after road construction. Reference sites can be considered a snapshot, or series of snapshots, of possible future outcomes. They demonstrate a point in time along a desirable developmental trajectory for a plant community. Using reference sites to understand the possible vegetative outcomes after disturbances will help the designer develop realistic expectations and provide a guide to the development of appropriate revegetation strategies for each revegetation unit. The most important aspect of reference sites is that they provide examples of plant communities from which designers can chose individual species for use in the revegetation project. The designer may sometimes choose to obtain baseline ecological data from several reference sites and then assemble DFC targets (SER 2004).
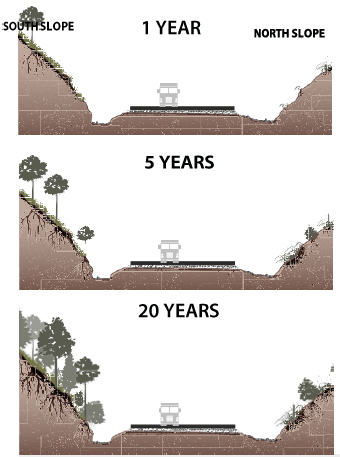 Figure 3-9 | Successional processes vary by microsite
 - Successional processes and plant communities vary considerably based on microsite conditions. In this example, plant communities developed differetly on north-facing and south-facing slopes.
The two types of reference sites are disturbed and undisturbed. Disturbed reference sites are areas, typically old road cuts and road fills that have recovered, whereas undisturbed reference sites are relatively pristine sites that lack major disturbances in the recent past. For most road projects, disturbed reference sites are the most helpful because they represent sites that are ecologically similar to the revegetation unit and have recovered from disturbances similar to those planned. Undisturbed reference sites may also be used when ecological restoration is an objective or when suitable disturbed reference sites are not available.
Disturbed reference sites can be categorized several ways:
- Type of disturbance
- Length of time after the disturbance
- Desirability of the recovered vegetation
Disturbed reference sites can be old road cuts and fills, abandoned roads, ground-based logging sites, waste areas, rock source sites, ski runs, or other areas that have recovered from major soil disturbances. Disturbed reference sites often show a range of possible vegetative outcomes years after disturbance. Some sites will show good recovery and include stable soil, be visually pleasing, and populated by functioning communities of native plants. Others might show what can go wrong if revegetation is not carried out properly, including erosion, poor ground cover, weed infestation, and a lack of native vegetation. Understanding the conditions that lead to these vegetative outcomes can be a guide to avoiding them in the future.
Disturbed reference sites are the best models to demonstrate what is possible on the site in terms of vegetation, what trajectories succession might take (with or possibly without human intervention), and ways to effectively intervene in order to facilitate desired outcomes. Disturbed reference sites are invaluable in developing realistic DFC targets. Ideally, the type of disturbance on a disturbed site matches the type of road construction disturbance that will occur on the revegetation unit. For example, if the road cut after construction will be denuded of topsoil, then a disturbed reference site is to be found that lacks topsoil.
The stage of recovery is also important. It is ideal to find several disturbed reference sites that represent different successional stages of site recovery (Figure 3-9). For instance, a revegetation unit would ideally be represented by a recently disturbed site (several years after disturbance), a recently recovered site (5 to 25 years after disturbance), and a fully recovered site (over 25 years since disturbance).
While there is no such thing as a “pristine” plant community, an “undisturbed” reference site is an area that has not been heavily affected by ground-disturbing activities. Undisturbed reference sites indicate the highest potential of a revegetation unit and are most often used as models when the goal is ecological restoration (re-creation of a plant community identical to that which existed before disturbance). The description of soil, climate, and vegetation in an undisturbed reference area often become the framework for the DFC target. It provides the designer with an understanding of those site characteristics or components necessary for healthy ecological
The process of selecting and describing reference sites is best accomplished in an interdisciplinary manner. The discussions that are generated between soils and vegetation specialists are generally far more thorough in knowledge and understanding of recovery processes than if surveys were conducted separately. Disturbed reference sites can be located by driving the roads in and around the project area and finding areas that appear similar to the type of road construction being planned for a revegetation unit. Revegetated road cuts of various ages are good reference sites for cut slope revegetation units.
Back to top
3.6 GATHERING FIELD INFORMATION
Surveying reference sites, as well as the project area in general, for soils, climate, and vegetation will provide baseline ecological data for developing the revegetation plan. If creating pollinator habitat is a revegetation objective, then reference sites and the project area are also surveyed to assess pollinator habitat quality and pollinator populations. This survey will provide insight into which pollinator species might be supported or enhanced by the revegetation project. The goal of the field survey is to obtain sufficient information from reference sites to realistically define DFC targets. During an initial survey, the appropriate survey intensity can be determined based on information needs and knowledge gaps. For example, if one of the revegetation objectives is to restore an abandoned road to a DFC target similar to a neighboring forest, then a survey of vegetation and soils of an undisturbed and disturbed neighboring forest would be conducted to describe the site characteristics and species composition.
Review the data used to define revegetation units (Section 3.3) prior to the field surveying of reference sites. Information regarding land ownership, site history, resources, and past and current management is also valuable. It is helpful to contact specialists who might have knowledge of the soils, vegetation, climate, and hydrology, as well as locals who can provide information on the site’s history.
3.6.1 VEGETATION FIELD ASSESSMENT
The objective of assessing the vegetation of a reference site is to create a comprehensive species list that will guide in the selection of species to be used for revegetating the project area. A good method for compiling a comprehensive species list is to choose a representative cross section of each reference site that will characterize the range of plant species for that unit. Intuitively controlled surveys, such as these, maximize floristic knowledge yet are less time and effort intensive than complete floristic inventories. Usually, a few plant species are not easily identified in the field. Samples of these species can be brought back to the office for identification by specialists. If more detailed data collection is desired, such as a complete floristic inventory, surveys along transects or grids may be conducted.
Once species are identified, a comprehensive species list is developed for the project (Table 3-6). This list will be used throughout the life of the project for selecting species for plant propagation, weed control, and plant protection. It includes some or all of the following attributes:
- Species name (common and scientific)–Because common names for plant species change throughout the country, it is important to list both the scientific and common names of each species. The USDA PLANTS database is a good source for obtaining the current scientific and common names. The database also includes the short species code symbol for field documentation.
- Revegetation unit–Identify the revegetation units where the species occurred.
- Ecological settings–Plants are identified by the ecological setting they are most commonly found in. A relative rating by temperature (cold, cool, warm, hot) and moisture (dry, moist, wet) gives a quick profile of the ecological setting. Some portions of the U.S. are covered by plant association maps or reports that were developed byfederal agencies and are good sources for identifying the ecological setting of a species. Another way to describe the ecological setting of a species is by using the Ecological Site Assessment section of the Web Soil website (Section 3.3.2). This part of the website groups soil mapping units into ecological site units and dominant plant species.
- Amplitude–Ecological amplitude is the recurrence of a species across a wide array of ecological settings. A species found in all ecological settings would have a high ecological amplitude, while a species found in only one ecological setting would have a low ecological amplitude.
- Abundance–The quantity, dominance, or cover of a species found in a revegetation unit is the abundance.
- Life form–Group each species by life form: (1) tree, (2) shrub, (3) annual grass, (4) perennial grass, (5) annual forb, (6) perennial forb, or (7) wetland species (e.g., sedges, rushes)
- Nativity–Identify whether the species is native to the local area or introduced. The USDA PLANTS database identifies the nativity of all plant species in the U.S.
- Weed status–The USDA PLANTS database identifies the noxious weeds for each state. State-listed noxious weeds are found under the heading “Introduced, Invasive, and Noxious Plants” under the “PLANTS Topics” sidebar. Contacting the local State agency in charge of maintaining the lists, usually state departments of agriculture, is recommended.
- Threatened and endangered species–State and federal protected plants are found in the USDA PLANTS database under the heading “Threatened & Endangered” on the “PLANTS Topics” sidebar.
- Succession–Determine the seral stage a species is most commonly associated with: (1) early, (2) mid, (3) late, or (4) climax. Visiting reference sites and adjacent areas at different ages of recovery following disturbance will help provide an understanding of where each species fits into ecological succession. Figure 3-9 illustrates how plant communities develop differently over time depending on site conditions and successional processes.
- Pollinator friendly–Reference the ERA to determine if a species is beneficial to pollinators. Use the ERA lists of pollinators associated with each plant species to build a highly diverse pollinator community; flower color is also helpful in this regard–the more the merrier. Flowering periods for plant species can be obtained from the ERA. Use these to maximize the seasons flowers are available to pollinators; a good minimum rule is three to five different species each of early, mid, and late bloomers. In addition to the ERA, other sources of reliable information such as species distribution maps by county from the USDA PLANTS website, or the I-35 Corridor plants list can give more detailed guidance to selection of appropriate species.
Table 3-6 | A comprehensive species list
Upon completion of a vegetation survey of the reference sites, a comprehensive species list is developed for the project. The spreadsheet will be used to determine the plant species mix that will be used in each revegetation unit.
| Scientific name |
Common name |
Revegetation unit |
Amplitude |
Abundance |
Life form |
Nativity |
Weed status |
Threatened and endangered |
Succession |
Ecological setting |
Pollinator friendly |
|
Achillea millefolium
|
Common yarrow
|
2,3
|
High
|
High
|
Perennial Forb
|
Native
|
–
|
–
|
Early
|
All
|
Yes
|
|
Abies grandis
|
Grand fir
|
1
|
High
|
High
|
Tree
|
Native
|
–
|
–
|
Late
|
All
|
No
|
|
Abies lasiocarpa
|
Subalpine fir
|
1
|
High
|
Mod
|
Tree
|
Native
|
–
|
–
|
Late
|
Cool
|
No
|
|
Agastache urticifolia
|
Horsemint
|
2,3
|
High
|
High
|
Perennial Forb
|
Native
|
–
|
–
|
Early
|
All
|
Yes
|
|
Agoseris aurantiaca
|
Orange agoseris
|
2,3
|
High
|
Mod
|
Perennial Forb
|
Native
|
–
|
–
|
Early
|
All
|
Yes
|
|
Agoseris glauca
|
Pale agoseris
|
2,3
|
High
|
Mod
|
Perennial Forb
|
Native
|
–
|
–
|
Early
|
All
|
Yes
|
|
Agoseris grandiflora
|
Bigflower agoseris
|
2,3
|
High
|
Mod
|
Perennial Forb
|
Native
|
–
|
–
|
Early
|
All
|
Yes
|
|
Allium acuminatum
|
Tapertip onion
|
4
|
Low
|
Low
|
Perennial Forb
|
Early
|
–
|
–
|
Early
|
Wet
|
?
|
|
Allium fibriatum
|
Fringed onion
|
4
|
Low
|
Low
|
Perennial Forb
|
Native
|
–
|
–
|
Early
|
Warm/Dry
|
?
|
|
Allium macrum
|
Rock onion
|
4
|
Low
|
Low
|
Perennial Forb
|
Native
|
–
|
–
|
Early
|
Wet
|
?
|
|
Allium madidum
|
Swamp onion
|
4
|
Low
|
Mod
|
Perennial Forb
|
Native
|
–
|
–
|
Early
|
Wet
|
?
|
3.6.2 SOILS FIELD ASSESSMENT
Understanding the soil characteristics of each reference site is essential to effectively define DFC targets and develop revegetation treatments. The soils report that is generated from the Web Soil Survey website for a road project gives a close approximation of the characteristics of undisturbed soils for the project area and are to be checked in the field. It is important to remember that the soil condition after road construction will not resemble the natural soils found in the soil survey. For this reason, it is important to find disturbed reference sites that are similar to the disturbance of the revegetation unit. The following information can be collected for topsoil and subsoil:
- Soil texture
- Rock fragments
- Rooting depth
- Topsoil depth
- Nutrient levels
- Soil structure
- Litter and duff layers (Section 5.2.3, see Litter and Duff)
- Site organic matter
- Infiltration rates
3.6.3 POLLINATOR FIELD ASSESSMENT
Habitat Assessment
During the field review, an assessment of the pollinator habitat and pollinator species populations may be conducted for the project area. The pollinator habitat assessment includes evaluating the road project plans within the context of the larger planning area for creating habitat supportive for general and at-risk pollinator species. Table 3-7 is a checklist that can be used to identify those factors important for creating pollinator-friendly habitat. Factors that improve pollinator health or habitat can be considered in design plans while factors that limit pollinator health can be mitigated or improved through management treatments or practices, presented in Section 3.9.
One approach to using this checklist is for the designer to visit the project site during planning and evaluate both the current condition of the roadsides and the undisturbed reference sites (Section 3.5). Ideally these assessments can be conducted during the same visits as the vegetation assessment (Section 3.6.1) and the soil assessment (Section 3.6.2). Evaluating the quality of pollinator habitat of the existing roadsides will give some indication of what the designer can expect if standard construction practices are employed. Comparing these findings to those of undisturbed reference sites gives the designer an idea of what is possible. Comparisons of the current condition and the reference site can help the designer develop a revegetation plan for improving pollinator habitat.
The Pollinator Habitat Assessment checklist provides eight characteristics important for most pollinator habitats. The designer may want to modify the checklist based on project objectives, pollinators of interest, and the unique ecology of the roadside. Another valuable use of the checklist is that it can be used to develop target DFCs for the revegetation project (Section 3.7). For example, a DFC target from this list may state that “at least three native species will be in bloom during spring, summer, and fall”. Field visits during the growing season would be conducted after revegetation to determine if this target was met.
Pollinator Monitoring
Revegetation projects, especially those specific to improving pollinator habitat, may require a pre- and post-construction assessment of pollinator species. As discussed earlier, it may be helpful to know which pollinators are present prior to project design. If imperiled pollinator species are suspected in the project area, it is important to survey for pollinators before undertaking construction. See Section 3.3.4 for resources for determining imperiled pollinators in the project area and check with the state Natural Heritage Program and land managing agency, as applicable, for a list of species of conservation concern.
Table 3-7 | Pollinator habitat assessment checklist
This guide can be used to assess the pollinator habitat conditions at any time during the life span of a road project. The checklist gives eight characteristics important for most pollinator habitats, however, the designer may want to modify the checklist so that it addresses the climate, soils, vegetation, and pollinator species of interest specific to the project area and project objectives. It is important when using the checklist to identify the purpose of the assessment, such as whether it is describing a reference site, pre-disturbance or post-revegetation conditions.
| Components of pollinator habitat |
Steps to improve pollinator habitat conditions |
|
Nectar/Pollen sources
|
- At least three blooming species in each season (spring, summer, fall)
- Species have overlapping and sequential bloom periods
- Presence of both wildflowers and woody blooming plants
- Aim for 45 percent plant cover of blooming plants available across seasons
|
|
Breeding habitat
|
- Host plants present for target butterfly and moth species
- Presence of vegetation, leaf litter that can serve as egg-laying sites for other species. At least three blooming species in each season (spring, summer, fall)
|
|
Nesting habitat
|
- Patches of bare ground present at site
- At least three species of woody plants or pithy stemmed plants that support tunnel-nesting bees
- Snags or downed wood present in safe location for traveling public
- Unmown bunch grasses present throughout growing season to support bumble bee nests
|
|
Water source
|
- Water sources such as culvert outlets, ditches, draws, gullies, intermittent streams, and topographic enhancements
|
|
Shelter and overwintering
|
- Trees and/or shrubs present at the site
- Diversity of grasses to provide vegetation structure
|
|
Vegetation management
|
- Mowing and herbicide use is timed to reduce impact to pollinator life cycles
- Mowing and herbicide use is timed to support plant diversity
- Herbicide use in roadside beyond the safety strip is targeted to noxious and nonnative plants and other undesirable species rather than using broadcast applications
- Weeds are controlled before and during construction to aid in plant establishment, as well as during the establishment phase
- If haying (mowing and removal of biomass) by adjacent landowners is permitted on the roadside, it is conducted once at the end of the growing season
- Prescribed fire and prescribed grazing are timed carefully to avoid damage to life cycles of imperiled or sensitive species of pollinators
- Brush removal is tapered to soften transition to denser vegetation at edge of ROW, opening up the canopy to allow understory plants to bloom and leaving some stems or other sites for tunnel-nesting bees
- Biological and cultural control methods are integrated into vegetation management to reduce use of herbicides to control noxious and invasive weeds
|
|
Landscape connectivity
|
- Site increases landscape connectivity by linking existing habitat parcels on nearby land
- Site increases roadside connectivity by linking roadside habitat
- Site increases diversity within the landscape and benefits agricultural activity on adjacent lands
|
|
Road mortality
|
- Site is not isolated within areas of high road density in which there are multiple barriers to pollinator movement
- Sites have reduced mowing and high plant diversity
- Clear zone width is increased within AASHTO guidelines along roadsides with high salt use and high volumes of traffic (reduces exposure of pollinators to salts, heavy metals)
|
It can also be helpful to monitor pollinators before construction and following revegetation in order to assess the success of the project or to perform comparisons of the effectiveness of seed mixes or revegetation techniques for different pollinators. Monitoring techniques for these assessments are discussed in Section 6.4.
Back to top
3.7 DEFINING THE DESIRED FUTURE CONDITION
Once revegetation units and corresponding reference sites have been described, the DFC targets can be defined for each unit. The DFC target is the translation of the revegetation objectives into measurable goals for each revegetation unit. Specifically, the DFC target defines the desired or expected composition of vegetation at a particular point in time after the completion of the revegetation work.
An example DFC target would be, “one year after seeding, vegetative ground cover will be 40 percent and of this cover, 50 percent will be composed of native forb species beneficial to pollinators.” Stating expectations in this manner will (1) clarify how the site will appear after treatments, (2) narrow down the appropriate revegetation treatments to meet the DFC target, and (3) define measurable criteria, or thresholds, for monitoring the success of a project.
Commonly stated DFC criteria include the following:
- Vegetative ground cover
- Bare soil cover
- Native grass cover
- Number of species of native grasses
- Native forb cover
- Number of species of native forb species
- Seedling survival
- Seedling density (plants per area)
- Tree growth (height per year)
- Coarse pollinator diversity
- Pollinator abundance
Stating the DFC in measurable terms and with a time frame ensures that the project team, regulatory agencies, and the public have similar expectations of how the project will appear in the years following its completion. Quantifying the objectives also focuses the monitoring plan to collect only the information necessary to determine if project objectives were met. For example, if one of the objectives is erosion control, a DFC target might be, “the amount of bare soil one year after road construction will be less than 20 percent.” Monitoring procedures would focus on measuring bare soil after one year. If another objective is to increase pollinator species, then a measurable threshold for success might be, “an increase of 50 percent pollinator abundance over reference site populations three years after seeding.” Monitoring, in this case, would measure general pollinator types in reference sites and revegetation unit three years after completion of the project.
Another benefit in defining DFC targets is that it often will generate a discussion of whether they are achievable without investing in soil improvement or additional plant establishment methods. Unless DFC targets are stated and discussed, individual team members will develop their own concept of what success looks like. For example, a road project was being proposed next to a river with high fisheries values. The Storm Water Pollution Prevention Plan that had been prepared for the project stated that the cut slopes would have 100 percent ground cover, which would result in very low sediment delivery to the stream after construction. Team members discussed this DFC target and concluded that it was unachievable because of the lack of topsoil and shallow soils. This left the team the choice of either modifying the DFC target or improving the soil quality.
For the designer
Defining the limiting factors is an essential process in developing a revegetation plan because it identifies, from a multitude of site factors, only those that are roadblocks to successful revegetation. A Limiting Factor table is available in this Planning workbook .
When developing DFC targets, it is important to consider the plant community succession that is likely to occur on each revegetation unit. In some cases, planting early seral species at the outset may work. By year 3, when the early seral species begin to decline, the late seral species may be increasing. In other cases, it may be necessary to intervene immediately after seeding or planting in order to meet the revegetation objectives of the project. For example, short-term revegetation planning might call for seeding grasses and forbs to stabilize the site. One year later, the site might be revisited to remove any invasive species before they produce seeds. Two years later, the site might be revisited to interplant conifers and shrubs. These three intervention points (seeding, weeding, and planting trees) speed succession in the desired direction.
Back to top
3.8 IDENTIFYING LIMITING FACTORS TO PLANT ESTABLISHMENT
Figure 3-10 | Limiting factors to revegetation - Limiting factors to revegetation can be displayed as unequal boards of a barrel. Water can only be held to the level of most limiting factor.
Site conditions that affect plant establishment and growth are referred to as limiting factors (Figure 3-10). Odum (1971) defines limiting factors as “any condition which approaches or exceeds the limits and tolerance (of a plant species).” He further states that “the chief value of the concept of limiting factors lies in the fact that it gives the ecologist an ‘entering wedge’ into the study of complex situations. Environmental relations of organisms are apt to be complex, so that it is fortunate that not all possible factors are of equal importance in a given situation or for a given organism.” Not only does this simplify a complex analysis, it means the designer will need to systematically consider all site factors, focusing on those of greatest concern. For example, typical revegetation treatments conventionally call for the blanket use of fertilizers without assessing if nutrients are really limiting to plant growth. In many cases, other limiting factors to revegetation, such as low rainfall, compacted soils, low organic matter, and poor rooting depth, are more limiting. Applying fertilizer without an assessment of limiting factors, is like a physician prescribing medicine before the patient has been properly diagnosed. While soil fertility is often important on many highly-disturbed sites, it might not be the primary limiting factor to revegetation on this particular site.
This manual has grouped the site characteristics essential for plant growth into six limiting factors to revegetation typically encountered in the United States. These factors are further broken down into component parts, or parameters (Figure 3-11). In this section, each limiting factor to revegetation and corresponding parameters are discussed in terms of why they are important to plant establishment and growth, how they are assessed, and what mitigating measures or treatments can be applied to make them less limiting.
The information used in defining limiting factors for each revegetation unit can be obtained from the surveys and reports conducted during the field surveys. It is important that an assessment of every limiting factor and corresponding parameter be made for each revegetation unit based on the expected condition of the site after road construction. Figure 3-11 can be used as a checklist—a means of quickly assessing a site for its potential to grow plants while preventing the possibility of overlooking factors important for successful revegetation. Much like pilots or surgeons use checklists, the designer can use the limiting factors list to simplify a “complex situation” and quickly identify what is important from what is not.
From the limiting factors identified for a project, a list of mitigating measures is developed. Mitigating measures are the site treatments that will reduce or eliminate the site conditions limiting to revegetation. For example, if rainfall is limiting, a mitigating measure is to irrigate. There are usually several ways to mitigate each limiting factor. While some of the mitigating measures might seem impractical for a particular revegetation project, they are at least considered.
How to approach this chapter—This chapter is organized by limiting factors. It is not important to read the whole chapter, but it can be helpful to read portions, especially those that pertain to the limiting factors identified for a project. Each limiting factor section discusses how to assess or record the factor and how to mitigate for it. Many of the mitigating measures discussed in this section are presented in further detail in Chapter 5. The mitigating measures described in this report are not a complete list. Consider other practices based on local or regional experience. Section 3.12 discusses how to select the appropriate site improvement measures from the mitigating measures list.
3.8.1 WATER INPUT
Water input refers to the moisture supplied to the soil through rainfall, snowmelt, and road drainage. This moisture recharges the soil and becomes the primary source of water for plant establishment and growth. Water input is influenced by obstacles that capture, or intercept, water before it can enter the soil, including standing live or dead vegetation and soil cover (litter, duff, and mulch). Surface infiltration rates also regulate entry of surface water. If infiltration rates are low, water that would normally enter the soil runs off the surface and is unavailable.
The primary site factors that affect water input are as follows:
- Precipitation
- Rainfall interception
- Infiltration
- Road drainage
In the western United States, water input is at its lowest levels from late spring through early fall. This is also the period when plants need the most soil moisture for survival and growth. During the summer, when water input is low, the soil profile dries out as vegetation withdraws moisture. As soil moisture is depleted, plants cease growing; if soil moisture is not recharged, plants will go into dormancy or die. It is critical that any water from precipitation arriving during the dry season enters the soil and is stored for later plant use.
Precipitation
In wildlands revegetation, the only source of soil water comes through precipitation in the form of rainfall or snowmelt. In the western United States, this typically occurs from late fall through mid-spring, a period when plants are dormant and least able to utilize soil moisture for growth. Water that is not stored in the soil during these events is lost from the site either to ground water or runoff. The period when plants need soil moisture the most occurs during a five- to six-month period, from April through October. For most sites in the western United States, the amount of moisture that occurs in this period is less than a quarter of the total annual rainfall. Precipitation is also extremely low during the middle of the summer (Figure 3-12).
Plant survival and growth hinge on the precipitation that occurs in the years following planting or seeding. Very low precipitation in summer is common in the western United States (those areas west of the 1-inch line) but less common in the eastern United States, as shown in this map of the U.S. which depicts normal precipitation over a 30-year period for the month of August. Much of California, Oregon, Nevada, Idaho, and Washington receive less than one-half inch of rainfall in August as compared to many areas in the mid-western and eastern United States that receive more than 4 inches of rainfall in the same month. This pattern is typical of other months during the growing season (map generated from PRISM).
Vegetation native to the western United States has evolved to compensate for the limited supply of moisture during the growing season (Figure 3-13). During spring, when soils are charged with moisture from winter precipitation and soil temperatures increase, plants produce new roots, followed by new foliage. As the soil dries out and plants undergo mild moisture stresses, new root and foliage growth cease. During summer, soil continues to dry and plants respond to even greater moisture stress by shutting down their physiological functions and becoming dormant. By mid to late summer, when available soil moisture is depleted and evapotranspiration rates are high, plants will show stress symptoms (browning, loss of needles and leaves); under extreme circumstances, plants will die. By late summer and early fall, rain returns and the soil slowly moistens again, reducing plant moisture stress and signaling plants to grow new roots.
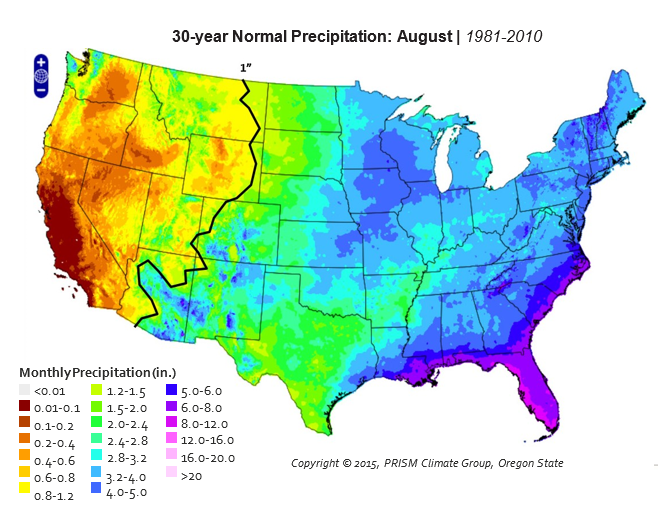
Figure 3-12 | 30-Year Normal Precipitation: August (1981–2010) - Plant survival and growth depend on the precipitation that occurs in the years following planting or seeding. Drought periods in the summer are common in the western United States (west of the 1-inch line) but less common in the eastern United States, as shown in this map of the U.S. which depicts normal precipitation over a 30-year period for the month of August. Much of California, Oregon, Nevada, Idaho, and Washington receive less than one-half inch of rainfall in August as compared to many areas in the mid-western and eastern United States that receive more than 4 inches of rainfall in August.
©2015 PRISM Climate Group, Oregon State University
The primary characteristic of precipitation for plant survival is the quantity of rainfall delivered in each storm event during the dry season. Storm events that deliver more than one-quarter inch of rainfall can wet the surface portion of the soil profile and reduce plant moisture stress. Precipitation events that deliver less than this amount rarely supply enough water to enter the soil, especially if interception and runoff rates are high.
How to Assess Precipitation—Average monthly rainfall for a project area can be accessed through climate websites, as discussed in Section 3.3.1. For more site-specific information, precipitation can be collected on-site using rain gauges that capture and record precipitation.
Two types of precipitation gauges are available: digital and non-digital. The advantages of digital gauges are that they record the amount and intensity of rainfall at the time it occurred; the downside is cost (although prices are falling). Many types of digital rain gauges are avail- able, ranging in price and quality. It is important to select a digital rain gauge that is rugged, self-maintaining, and can record for long periods of time. In addition, many remote stations have the capacity to transmit data via the web so it is easy to keep current on weather events.
Non-digital rain gauges are basically cylinders that collect and store precipitation while preventing evaporation. The gauges are monitored by simply measuring the water in the cylinder. The disadvantage of non-digital rain gauges is that they only report the rainfall that has occurred between site visits. They do not provide the dates when rainfall occurred and do not record rainfall intensities.
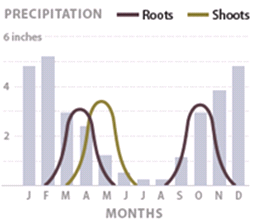 Figure 3-13 | Root and shoot growth
 - In the western United States, root and shoot growth occur when moisture is available in the spring. Growth ceases by early summer when there is very little rainfall. Root growth takes place again from late September through November when soils are recharged by fall rainstorms.
Mitigating for Low Precipitation—For projects where rainfall is limited during the growing season, making the most of rain and snowmelt that falls throughout the year is an important art of successful revegetation planning. In most cases, supplemental watering will not be feasible. However, if very little water input occurs during the summer, temporary supplemental water could be considered during plant establishment. This can take an active form, such as irrigation, or a passive form, such as redirecting surface water to planted seedlings.
Irrigation—Irrigation can be expensive, and it is generally used only on projects with high visibility or when rapid establishment is necessary for slope stability. These are projects where revegetation objectives include minimizing the risk of seedling failure or enhancing vegetation growth.
Several basic types of irrigation systems are used in roadside revegetation. They are grouped into fixed systems, such as overhead sprinkler and drip irrigation, and manually applied systems. Fixed systems are discussed in Section 5.5.5 (see Drip Irrigation). Manual systems involve water being delivered directly to each plant, either from a hose or water container.
If only a few applications are necessary, the entire project can be irrigated by hand. Personnel can water each seedling or seeded area using a water truck or hydroseeding equipment (with water only), although being mindful of not pulling hoses over establishing plants can help ensure plant survival. Creating basins around seedlings will pond the surface-applied water and keep it concentrated in the seedling root zone.
However, a better way to be certain that water will be delivered directly to the roots is to integrate the deep pot irrigation system into drip or manually applied irrigation methods (Bainbridge et al 2001). Pipes made from polyvinyl chloride (PVC) or other materials are placed at depths of 1 to 2 feet beside the seedling at the time of planting. The pipes are then filled with water when the soils dry out in summer. The advantage of deep pipe irrigation is that water is delivered directly to the root system and, because the water is placed deeper in the soil, roots are forced to extend farther into the soil for moisture. Refer to Section 5.5.5 (see Deep Pot Irrigation) for how to install this system.
 Figure 3-15 | Planting pockets
 - Planting pockets are designed to capture water from upslope runoff (A), which collects in a slight depression (B). Captured water wets the soil after each rainstorm and drains into the fractured bedrock (C). Soil is protected from surface erosion on the downhill side of the pocket with mulch or erosion fabric (D).
For any irrigation method, it is important to monitor the wetting pattern of each irrigation. This will ensure that water is applied at the appropriate rates. Digging a hole where the water has been applied at least several hours after irrigation will show how far the water has moved into the soil profile. Duration of irrigations can be adjusted accordingly.
Water Harvesting—Water harvesting is the alteration of local topography to capture runoff water and concentrate it in areas where it can be used by plants. Water harvesting designs can be applied to roadside revegetation in several ways. They include, but are not limited to, contour bench terraces, runoff strips, and fill slope microcatchments. Fill slope microcatchments take advantage of water that drains off road surfaces and shoulders during intense rainstorms by capturing runoff in berms or depressions created at the base of the road shoulder (Figure 3-14). Shrubs and trees planted in these catchment areas will receive greater soil moisture. Contour bench terraces are structures carved out of cut and fill slopes that collect and store runoff water. When filled with topsoil or amended soil, they are referred to as planting pockets. Figure 3-15 shows how planting pockets collect water. Even very low rainfall events, which would normally be of insufficient quantity to moisten the soil surface, can recharge soil in planting pockets and fill slope microcatchments. Sediments will also be deposited on the benches and pockets during rainstorms, building the soil up over time and reducing soil erosion. Water harvesting not only supplies additional water to plants but reduces sediment and peak flow water to the stream system. Road practices that intercept water and sediments from the road surface for water quality improvement are also a source of additional water for plant growth. These include amended slopes, filter strips, amended ditches, bio-retention swales, and constructed wetlands. In addition, some of these structures create surface-water sources for pollinator species.
Rainfall Interception
The amount of water entering the soil profile from a rainfall event can be significantly reduced by the interception of live or dead vegetation cover. Rainfall is captured through a series of layers, beginning with the tree and shrub canopy, the ground cover, litter, and duff, and is returned to the atmosphere through evaporation. During the dry season, moisture from a low rainfall event might not reach the soil.
How to Assess Rainfall Interception—Rain- fall interception can be determined by the soil cover and vegetation that exist on the site after construction. In most cases, there will be very little vegetation and ground cover. It is therefore important to understand the effects of various types of ground cover used in revegetation on the rainfall interception. The depth and water-holding capacity of the material will determine the effect on water input.
Water-holding capacity of a surface cover can be measured through testing labs specializing in composts. Alternatively, it can be measured by collecting the soil layer (duff, litter, mulch) and drying it at 230° F in a drying oven (a crockpot can be used, adjusting the temperatures using a meat thermometer). When the sample is dry, it is placed in a 5-inch-long by 3-inch-round PVC pipe with a flat piece of cardboard secured to the bottom of the tube to prevent the material from falling out. The PVC pipe is weighed and placed in a bucket that is filled with water to the top of the pipe. The sample is removed and allowed to drain.
After several hours, the pipe is reweighed. The material in the pipe is removed and the pipe plus cardboard is weighed. The moisture holding capacity of the material (by percentage of dry weight) is as follows:
(Wet weight of container and cardboard) - (Dry weight of container and cardboard)
(Dry weight of container and cardboard) * 100
Figure 3-16 can be used to approximate how much rainfall is intercepted based on the moisture-holding capacity of the soil cover.
Mitigating for High Rainfall Interception—It is important to consider the water-holding capacities of the mulches or soil covers to be used, especially on arid sites. Highly decomposed, fine-textured composts have high water-holding capacities compared to coarser-textured composts and hold more moisture after a rainstorm. Coarser materials, such as shredded wood, bark, wood chips, and wood strands, hold less water, allowing more rainwater to enter the soil. In addition, because fine-textured composts hold more water than course mulches or soil, they are good growing media for desirable native plants as well as undesirable weed species. The question to ask when selecting a soil cover is whether it is to be used as a mulch or a growing media. If a mulch, then consider using a coarse material; if growing media, consider using a fine compost.
Infiltration
Infiltration is the ability of the soil surface to absorb water from rainfall, snowmelt, irrigation, or road drainage. When infiltration rates are slower than the amount of water applied to the surface of the soil, runoff will occur and this water will not be available for plant uptake. In addition, runoff can detach and transport soil, causing soil erosion, decreased water quality, and increased peak flows. Refer to Section 3.8.5 (see Infiltration Rates) for a discussion of infiltration rates on surface stability.
The size, abundance, and stability of soil aggregates in the surface soil determine the infiltration rates. Large stable pores created by worms, insects, and channels left behind from decayed roots will absorb water quickly and have high infiltration rates; soils that have been compacted, had their topsoil removed, or are low in organic matter will have poor infiltration rates.
Under undisturbed conditions, infiltration rates are typically high, especially where a litter and duff cover exists. When soil cover is removed, the impact from rain splash can seal the soil surface, creating a crust that will significantly reduce infiltration rates. Infiltration rates are also reduced when the soil is compacted by heavy equipment or traffic.
How to Assess Infiltration—The most accurate method to measure field infiltration rates the rainfall simulator (Section 3.8.5, see Infiltration Rates). This equipment is calibrated to simulate the appropriate drop size and impact velocity of many rainfall events (Grismer and Hogan 2004). The rainfall simulator is expensive to operate and is not routinely used by the designer. The most common application for this technology is in comparing different mitigating measures, such as mulches and tillage methods, on infiltration capacity.
In the absence of rainfall simulation tests, infiltration rates are inferred by measuring soil strength using a soil penetrometer, bulk density measurements (Section 3.8.6, see Soil Strength), and from site characteristics such as visual observation of compaction and the percentage of soil cover. For most construction activities that remove surface cover or disturb the topsoil, it can be assumed that infiltration rates will be reduced to levels that will create overland flow under most rainfall intensities.
Mitigating for Low Infiltration Rates
Minimize Compaction—Driving heavy equipment over soils causes compaction and reduces infiltration rates. After sites have been prepared for seeding or planting, avoid driving heavy equipment over soils. Practices that are often recommended for erosion control, such as trackwalking, can actually decrease infiltration rates and adversely affect the establishment and cover of native plants. These practices may not be appropriate on all soil types and can be assessed on a site-specific basis (Grismer and Hogan 2007).
Tillage—Infiltration rates can be increased through soil tillage, including subsoiling, ripping, and disking (Section 5.5.2). In most cases, tillage will reduce compaction and increase macro-pore space in the surface soil, as well as create surface roughness that further increases infiltration rates. Depending on the stability of the surface material and the level of organic matter, the effects of tillage on infiltration might only be effective for a short time. Under some conditions, tillage needs to be planned into the design of the road. Concentrated water from poorly designed road drainage or inadequate road maintenance has the potential to create deep gullies on tilled soils. Steep slopes in areas of high precipitation have a higher risk of slope failure if tilled slopes are not designed appropriately (Section 3.8.5, see Mitigating for Steep Slope Gradients). Deeper tillage and sculpting the subsoil are some methods to reduce these risks (Section 5.5.2).
Organic Amendments and Tillage—Incorporating organic amendments into the soil surface using a bucket of an excavator can create large, stable pores. However, unless the pores are interconnecting, they will not drain well (Claassen 2006). One method for creating continuous pores is to use long, slender organic material, such as shredded bark or wood, composted yard waste, straw, or hay (Section 5.2.5). Compared to short organic materials such as wood chips, longer materials can increase infiltration rates. Incorporating higher quantities of organic matter in the soil will also increase porosity because of the potential of the organic material to overlap and interconnect.
Mulch and Tillage—Applying mulch by itself does not necessarily increase infiltration rates, although it can reduce sediment yields (Hogan and Grismer 2007). However, combined with surface tillage in the form of subsoiling or ripping prior to application of mulch, infiltration rates can be significantly increased. Mulch fills in the micro-basins left from the tillage operation (Figure 3-17).
Establish Vegetation—Ultimately, the best method to increase infiltration is to create conditions for a healthy vegetative cover. Good vegetative cover will produce soils with extensive root channels, aggregated soil particles, and good litter layers.
Road Drainage
Depending on how the road is designed, surface road water from precipitation events is either dispersed or concentrated. Dispersed water is often seen on outslope or crowned roads, where water moves in sheets over the road surface during rainstorms and into the fill slopes. This water can be captured by water harvesting methods (Section 3.8.1). Concentrated water occurs where runoff from the road surface and cut slopes, as well as intercepted water from seeps and streams, is collected in ditches that flow into culverts or other road drainage structures. When designed into the road drainage system, this water can be available for plant growth. Live silt fences, bio-retention swales, and constructed wetlands are some structures that take advantage of this additional water.
How to Assess Road Drainage—Road drainage is assessed by identifying drainage patterns on the road plans. Often the Storm Water Pollution Prevention Plans will show the detailed direction of surface road water. Culvert outlets are the areas most likely to have concentrated water that can be considered for use for plant establishment and standing water for pollinator habitat.
Mitigating for Road Drainage
Species Selection—In areas below culverts, soil moisture is typically higher than surrounding areas after rainstorms or snow melt. These areas may be suitable for more moisture-sensitive plant species that require increased soil moisture. When planted with plant species that support pollinators, these sites will increase pollinator habitat.
Large Wood—Obstacles, such as large wood, can be placed at the base of culverts or perpendicular to the slope to slow concentrated water and increase soil moisture in these areas. Large wood also provides nesting habitat or shelter for many pollinator species.
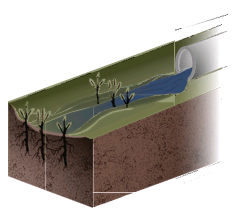 Figure 3-18 | Live silt fence
 - In gullies, draws, intermittent streams, or below culvert outlets, live willow stakes are placed in rows, creating what is referred to as a live silt fence, to slow water velocities and catch sediment and debris (Polster 1997). The stakes root and establish into plants over time
Biotechnical Slope Protection—Gullies can form below culvert outlets and, for this reason, these sites are often armored with rock. Moisture-loving vegetation, such as willows, sedges, and rushes, can be integrated into the hardened surfaces, such as live silt fences, as shown in Figure 3-18 and as discussed in Section 5.4.3.
Water Harvesting—Road surfaces, shoulders, and to a lesser extent, cut and fill slopes are impermeable surfaces that create runoff water during precipitation. Utilizing this water for plant growth, as shown in Figure 3-14, is a form of water harvesting.
3.8.2 AVAILABLE WATER STORAGE AND ACCESSIBILITY
The previous section discussed how water enters the soil surface. This section describes how water is stored in the soil and how soil water is accessed by roots. Where precipitation is low or infrequent during the growing season, the amount of water a soil can hold between rainstorms is important from a plant survival and growth standpoint.
The total available water-holding capacity (TAWHC) is the sum of all water stored in the soil profile that is available to plant roots. The amount of water that a soil can store is primarily a function of the following:
- Soil texture
- Rock fragments
- Soil structure
- Rooting depth
- Mycorrhizal fungi
The amount of water a soil stores and how easily it is accessible by roots determines the types of species and the amount of vegetative cover a site can support.
Soil Texture
Soils are composed of minerals of varying sizes, ranging from clays (the smallest) to sands (the largest). Each mineral particle in a soil sample can be grouped into one of three categories depending on its size:
- Clay— <0.00008 in (0.002 mm)
- Silt— 0.00008-0.002 in (0.002 to .05 mm)
- Sand— 0.002-0.08 in (0.05 to 2.0 mm)
The proportion of these size groups in a soil is called the soil texture.
Figure 3-19 shows 12 soil textural classes by their proportions of sand, silt, and clay as defined by the U.S. Department of Agriculture classification system (Soil Survey Staff 1975). Two other soil classification systems, the American Association of State Highway and Transportation Officials (AASHTO) and the Unified Soil Classification systems, are used for geotechnical engineering. These two systems use different particle size ranges and include parameters such as liquid limit and plasticity in classifying soils. There is no accurate way of converting values from these systems to the USDA textural classes.
Soil texture is an important function of soil water storage because the unique arrangement of pores created in each texture class holds differing quantities of moisture. Clays are typically thin, wafer-like particles with highly charged surface areas that retain large amounts of water.
Inset 3-1 | | Measuring available water-holding capacitye - Available water-holding capacity (AWHC) can be measured in the field by collecting soil samples from a reference site or disturbed site in mid- to late summer when soils are presumably at their driest. Collect samples in bulk density rings in the same manner as sampling for bulk density (Section 3.8.6, see Soil Strength). After removing the ring from the soil, secure a piece of card- board at each end of the ring to keep the soil from falling out, then place it an airtight plastic bag to ensure the sample stays intact during transport. When ready to take measurements, remove the top cardboard piece and weigh the sample. Place the sample in a bucket and fill with water to just the top of the ring. Allow the sample to saturate with water. Once the soil is fully saturated, remove the ring and allow it to drain. After 24 hours, remove the soil from the ring and weigh the soil (this is the wet weight), also weigh the ring and cardboard (allow the cardboard to dry first). To calculate the dry weight, subtract the weight of the dry cardboard and ring from the original dry sample weight.
Available water-holding capacity (inches of available water per foot) =
(wet weight – dry weight) /
Modified after Wilde et al 1979
Clay particles are often arranged to form small void spaces, or micropores, that also store water. Sands, on the other hand, are large, rounded particles that have a very low surface area and therefore do not hold as much water. The large pores (macropores) that are created when sand particles are adjacent to each other are good for air and water flow but poor for storing water. Soils high in silts hold more water than sands because of the greater quantity of micropores. However, silt particles are not charged, therefore holding less water than clays.
How to Assess Soil Texture—Soil texture can be determined fairly accurately in the field using the “feel” test. This is done with the aid of a soil sieve (2 mm opening size) and a bottle of water. Obtain a fairly dry field sample and separate the fine fraction from the coarse fragments with the sieve (note the volume of gravel in the sample). Take a sample of the fine fraction in the palm of the hand and moisten it with water. The soil is rubbed between the fingers and thumb and classified using the decision tree in Figure 3-20.
For a more exact determination of soil texture, a sample of soil can be sent to a soils laboratory for a particle size distribution test. This test will report the percentage of sands, silts, and clays in the sample. A Web Soil Survey report (Section 3.3.2) generated for the project area will also provide a good estimate of the soil textures.
Knowing soil texture is essential for estimating the available water-holding capacity (AWHC) of a soil. Figure 3-21 shows some typical available water-holding capacities for various soil textures. The values in this figure are generalized, but are acceptable for making recommendations on most revegetation projects. The Web Soil Survey and Soil Characterization Data websites (Section 3.3.2) may have available water-holding capacities for soils in the project area. For a more accurate assessment, samples can be sent to soils labs for moisture determination. This is a specialized test and not all labs offer this test; therefore, it is important to contact the lab prior to collecting samples. Water-holding capacity can also be measured using the methods outlined in Inset 3-1.
Mitigating for Textures with Low Water-Holding Capacities
Organic Amendments. Incorporation of organic amendments (e.g., compost, biochar, biosolids) can increase the water-holding capacity of a soil. Because the water-holding capacity of each type of organic matter varies by composition and degree of weathering, the effect on soil water-holding capacity by any organic matter being considered is assessed prior to application (see Section 5.2.5 for assessment methods). Sandy textured soils benefit most from organic matter additions, especially those with plant available water of 9 percent or less (Claassen 2006), which are typically sands, loamy sands, and sandy loam soils. Testing several different rates of incorporated organic matter on soil moisture-holding capacity prior to selection will help determine the appropriate amount of material to apply.
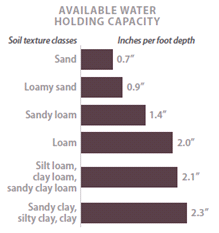 Figure 3-21 | Soil texture and available water-holding capacity
 - This chart shows the general relation- ship between soil texture and available water-holding capacity soils (adapted after Ley et al 1994). As clays increase in a soil, so does water-holding capacity. Typically, clay loam soils hold more than twice as much water as sandy textured soils. The presence of humus in topsoil increases water-holding capacity of loams and sandy loams at a rate of 2.25 percent water to each percent rise in soil humus (Jenny 1980), which equates to an approximately 0.75 percent increase in water holding capacity for every 1 percent increase in organic matter.
Clay—The water-holding capacity of sandy textured soils can be increased by incorporating soils with higher clay fractions into the sandy soils. These soils should have no more than 40 percent clay fraction (e.g., clay loam, sandy clay loam, and silty clay loam textures). Consider adding clays at rates that result in new soil textures similar to loams, silt loams, or sandy clay loams. Higher rates of clay addition are not recommended. It is always important to test the additions of any soil to another to understand what the effects on water-holding capacity and structure might be. Ideally this is done in the field in small plots.
Polyacrylamides—Polyacrylamides are hydrophilic polymers that absorb many times their weight in water. They are used to increase the water-holding capacity of greenhouse growing media. The value of using these materials in revegetation projects, however, is questionable based on the low plant response rates, high material costs, and difficulty of incorporating these materials evenly into the soil. A study, located at several semi-arid sites, showed that two rates of polyacrylamide crystals incorporated into road fills had no differences in native grass cover and survival and growth of outplanted pine seedlings from the controls (Riley et al 2013). Consider testing any full-scale use of polyacrylamides at different rates on the sites being revegetated. In addition, determining how polyacrylamide crystals would be evenly mixed into the soil is an important consideration when considering use of these materials.
Rock Fragments
Mountain soils and highly disturbed sites are typically high in rock fragments. The presence of rock fragments is important because rock reduces the amount of water and nutrients a soil can hold. At high volumes in the soil, rock fragments will limit the biomass and vegetative cover a site can support.
The rock classification system classifies rock fragments into the following five size ranges:
- Fine gravels - 0.08 to 0.2 in (0.2 to 0.5 cm)
- Medium gravels - 0.2 to 0.8 in (0.5 to 2.0 cm)
- Coarse gravels - 0.8 to 3 in (2.0 to 7.0 cm)
- Cobble - 3 to 10 in (7.0 to 20.0 cm)
- Stone - >10 in (20.0 cm)
Highly weathered rock can retain some soil moisture depending on the size of the rock fragments and degree of weathering (Flint 1983). For practical purposes, however, it is usually assumed that the presence of cobbles and stone rock fragments in the soil will reduce the available water-holding capacity of the soil proportionally. For example, a sandy loam soil without rock fragments has a water-holding capacity of 1.4 inches per foot of soil (Figure 3-21). When 30 percent large rock fragments are added to the soil profile, the available water-holding capacity is reduced to 70 percent, or 0.98 inches of available water (1.4 * 0.7 = 0.98 ). Alternatively, fine and medium gravels (0.08 to .8 inches in diameter) hold some moisture. A rule of thumb is that these fine and medium gravels reduce water-holding capacity by two-thirds of their volume. In the above example, if 30 percent of the soil were composed of medium and fine gravels, the available water in this soil would be 1.12 inches per foot ( 1.4 - ( 1.4 * 0.3 * 0.66 ) ).
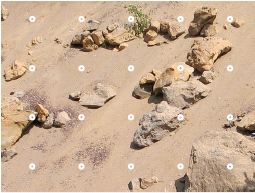 Figure 3-22 | Estimating rock fragment content from roadcuts
 - The amount of rock in a section of soil can be roughly estimated from road cuts. Large rock can be determined by laying a grid of 20 circles over a photograph of a road cut and recording the number of circles intercepting rock (in the center of the circle). This value is divided by the total number of circles in the grid to obtain the percentage of subsoil in rock fragments. In the picture below, subsoil contains approximately 25 percent large rock (5 intercepted rocks divided by 20 points).
Photo credit: David Steinfeld
How to Assess Rock Fragments—Rock fragment content is usually determined in the field. Large rock fragments, such as cobble and stones, are estimated in a variety of ways. The most common methods are surveying freshly exposed road cuts or observing soil excavation during road construction. Estimating the volume can be difficult, and often the amount of rock is over- or under-estimated. One method of estimating large rock in road cuts is to take a digital picture and lay a grid over the surface, as shown in Figure 3-22. Whenever rock is estimated from old road cuts, it is necessary to determine whether a portion of the rock is masked by soil that might have moved over the rock. A freshly exposed road cut provides the most accurate approximation of rock content.
Rock encountered while digging a soil pit will provide a more accurate estimate of larger coarse fragments. Cobbles and stones, if they can be moved, are set apart from the soil when the pit is excavated. The volume of cobbles and stones is then visually compared to the volume of soil excavated from the soil pit to estimate the percentage of rock fragments.
Gravel content is determined from the excavated soil by sieving it through several soil sieves. Sieves are available through most engineering equipment companies (Figure 3-23). The 2-mm sieve (also referred to as a #10 sieve) is the most important sieve to use because it separates the gravels from the soil fraction. Another useful sieve is the ¾-inch sieve because it separates the fine and medium gravels from the coarse gravels. This sieve can be used in the field to remove larger rock fragments from the soil sample to reduce the weight of the sample. When soils are dry, they are easier to sieve in the field; however, when they are moist, soils are air dried first before they can be sieved. The gravel and soil volumes are visually estimated..
It is important to include the volume of cobbles and stones estimated in the field with the gravels estimated through sieving to calculate the total rock fragments in a soil:.
% rock fragments in profile = (100 - % cobbles and stone) * % gravels in sample
For example, a soil is estimated to have 25 percent cobbles and stones from observing road cuts and from several soil pits. Sieving shows that 50 percent of the sieved soil is composed of gravels. The soil would be composed of 25 percent cobbles and stones, 37.5 percent gravels (( 100 – 25 ) * 0.50 ), and 37 percent soil.
Mitigating for High Rock Content
Rock Removal—Screening rock fragments from the soil will increase the available water- holding capacity of a soil. The greatest benefit from screening is with soils that are very high in cobble and stone, where the reduction in volume of rock in the soil would be significant. One type of screen is the “grizzly feeder” which acts as a giant sieve to sort out rock of any size depending on the screen opening widths. Screened soils have the greatest benefit where soils are shallow or a good ground cover is necessary (e.g., grasses and forbs).
Incorporate Compost—Compost incorporated in the soil at high rates will increase the water-holding capacity of a rocky soil (Section 5.2.5). Depending on the size of the coarse fragments, incorporation can be difficult.
Surface Apply Compost—A more practical method to mitigate for rocky soils is to apply composts to the soil surface without mixing. When surface applied, composts can be good growing media for seeds of grasses and forbs (Section 5.2.3). At rates greater than 3 inches applied to the surface, seeds germinate well and establish into seedlings that can access moisture and nutrients not only from the compost, but also some moisture from the rocky soil below the compost. Be aware that on steep slopes, if the site is not prepared correctly, the layer between the compost and soil can become a slip plane on slopes when compost becomes saturated with water (Section 3.8.6, see Mitigating for Low Permeability).
Apply Topsoil—If topsoil is available, it can also be applied over a rocky soil (Section 5.2.4). Topsoil will have to be placed deep enough to compensate for the quantity of rock in the soil being covered. On steep slopes, preparation of the site prior to application of topsoil is important to avoid slope stability problems (Section 3.8.5, see Mitigating for Steep Slope Gradients).
Planting Islands—On very rocky sites, rocky soils can be mitigated by focusing mitigating measures into planting islands (Section 5.2.8). Where topsoil, compost, or screened soil is limited, this material can be concentrated in mounds, pockets, or benches strategically located throughout a revegetation.
Soil Structure
 Figure 3-24 | Compacted soil
 - Compacted soils are created by heavy equipment operating over soil. The large pore spaces are compressed and the impacted soils often form a platy structure as shown in this photograph.
Photo credit: Tom Landis
Just as soils are composed of many-sized mineral particles, they are also composed of differ- ent-sized voids (also referred to as pores) whose influence is responsible for water movement, water storage, air flow, and root penetration. Small pores (micropores) strongly influence the moisture-holding capacity of soils, while large pores (macropores) are responsible for water movement, air flow, and root penetration. Soil structure is the arrangement of soil particles into aggregated units that gives rise to the macro-porosity in the soil. It is qualitatively observed as cracks, channels, aggregates, crumbs, and clods in the soil, and described by alternative terms such as friability and tilth. Water flow and root penetration depend on good soil structure. If soil structure is poor or compacted, roots are less able to penetrate the soil to access water. Soil structure is important for other soil functions such as air flow, drainage, permeability, infiltration, and essential habitat for most soil organisms.
Soil structure is significantly reduced by operating heavy equipment over soils. The pressure applied by heavy equipment compacts the macropores, reducing soil volume and increasing soil density. This impact is called soil compaction (Figure 3-24). The effects of soil compaction on tree growth are well documented (Poff 1996). Trees growing on highly compacted soils have far less root, stem, and leaf production than those growing on non-compacted sites. Studies have shown a linear relationship between the increase in surface soil bulk density and decrease in height growth of young Douglas-fir and ponderosa pine trees (Froehlich and McNabb 1984).
It is a safe assumption that soils will be highly compacted after construction due to the use of heavy equipment. In addition to reducing the potential of a construction site to grow vegetation, compaction also increases runoff and sediment during rainstorm events, which can impact water quality. On sites where summer rainfall is limiting, there will also be less water entering the soil, reducing the amount of water available for plant growth.
Compaction can occur several feet below the soil surface, depending on soil texture, moisture, and the type and weight of equipment being operated. Very compacted soil layers can significantly reduce or eliminate root penetration. Where compacted layers occur, downward water movement is restricted and water may saturate the soil layers above the compacted layer. The resulting saturated soil conditions can be very restrictive to root growth because of the lack of oxygen and the propensity for higher incidence of disease (Steinfeld and Landis 1990) and seedling mortality (Figure 3-25). Compacted layers will naturally recover to their original porosity through root penetration, animal activity, and freeze-thaw events, but recovery can take 20 to 70 years (Wert and Thomas 1981; Froehlich et al 1983).
 Figure 3-26 | A soil core is used to assess soil compaction
 - Soil compaction can be assessed by measuring bulk density of a soil. The most common method is to drive a cylindrical tube into the soil, as shown in the photograph, and weighing the soil after it has been dried.
Photo credit: David Steinfeld
How to Assess Soil Structure—It is easy to qualitatively differentiate good soil structure from compacted soil, but measuring it quantitatively can be difficult. Indirect field tests to quantify soil structure include bulk density and penetrometer tests.
The bulk density test measures the dry weight of a standard volume of soil. If the soil has a high porosity, the bulk density values will be low; if the soil is compacted, the bulk density will be high. In this method, a cylindrical tube is driven into the soil with a portable bulk density sampler and a soil core is removed (Figure 3-26). The soil is shaved evenly on both ends so that the soil is exactly the shape and volume of the cylinder. The soil is then removed from the cylinder, oven-dried, and weighed.
Bulk Density = Weight of dry soil (g) / Cylinder volume (cc)
Bulk density values of a disturbed site are related back to the bulk density of an adjacent reference site to make the values meaningful. Remaining within a 15 percent increase in bulk density over reference site values is ideal. Unfortunately, the bulk density method is time consuming and cannot be conducted on soils with high rock fragments.
A less quantitative, but more practical, method of measuring soil porosity is with a soil penetrometer. This equipment measures soil strength instead of density. Compacted soils have greater strength, and greater resistance to penetration by a penetrometer, than non-compacted soils. Several types of penetrometers can be purchased for field work—penetrometers that measure the resistance as a continuous pressure is applied to the probe and penetrometers (impact penetrometers) that measure the number of blows of a hammer to drive the penetrometer into a specified depth. A monitoring procedure for assessing compaction using an impact penetrometer has been developed by the NRCS (Herrick et al 2005b). The most practical and economical field method for assessing compaction, however, is simply using a long shovel, as shown in Figure 3-27. In this method, a site is traversed and, at predetermined intervals, a shovel is pushed into the ground to determine how loose the soil is. By applying the entire body weight to the shovel and observing the distance the shovel penetrates the soil, a qualitative measurement of soil compaction can be made. A rule of thumb is that a shovel penetrating over 12 inches deep indicates a soil with a very high porosity; penetration below 3 inches deep indicates a very low porosity.
Whether a shovel is used or a soil penetrometer, the readings are affected by rock content and soil moisture. When soils are dry, they have greater strength and higher resistance to penetration. This is why any comparative sampling (e.g., comparing reference site to construction site soils) using a penetrometer is done at the same moisture levels. Encountering large rocks can be confused with hitting a compacted layer. When this occurs, sampling should be done at several adjacent points until the penetrometer can be pushed into the soil without hitting rock. On very rocky soils, the penetrometer is not a practical tool.
Mitigating for Poor Soil Structure
Tillage—Breaking up compacted layers can be done effectively when deep tillage equipment is operated correctly (Section 5.2.2).
 Figure 3-27 | A shovel can be used to determine depth to compaction
 - A simple, qualitative method of determining compacted layers is to mark the face of a long shovel with a ruler. Pushing the shovel in the ground with the entire body weight and observing the distance the shovel penetrates can indicate the depth to a compacted layer.
Photo credit: David Steinfeld
Incorporate Organic Matter—The effectiveness of deep tillage can be enhanced if organic matter is incorporated into the soil prior to tillage (Section 5.2.5). Organic matter can keep the soil from settling back to higher, pre-tillage densities. Application rates at which organic matter showed positive effects on soil structure was observed at a ratio of 25 percent incorporated organic matter to 75 percent soil by volume (Claassen 2006). Longer shreds of organic matter are preferred over smaller, chip sizes because the longer strands create interconnecting pathways for water, air, and roots while increasing soil strength (Claassen 2006). The additions of non-composted organic matter, however, will tie-up nitrogen for a period of time. While this might be problematic in the short term, the importance of developing soil structure for long- term site recovery often overrides concerns about the lack of immediately available nitrogen.
Operate Heavy Equipment with Care—Soil compaction is greatest when soils are moist. To limit the amount of soil compaction, schedule equipment operation during times when soils are dry. Compaction can also be minimized by using smaller equipment (Amaranthus and Steinfeld 1997) or leaving slash or deep mulch on the soil surface (which provides cushion).
Avoid Last Minute Compaction—Soil compaction is unavoidable during construction, but compacting soils after mitigating treatments have been implemented, such as tillage, is to be avoided. In many cases the benefits of mitigating treatments have been nullified by the lack of attention to heavy equipment operations after topsoil additions or tillage treatments have been made. For example, topsoil salvage and placement, as discussed repeatedly in this manual, benefit the site in many ways. But this expensive mitigating measure loses much of its value if the soils are compacted during or after soil placement. Once topsoil is deep-tilled, every effort should be made to avoid any further equipment operation on the site.
Encourage Mycorrhizae Establishment—Mycorrhizal fungi build soil structure through hyphae and water stable organic glues (e.g., glomalin). Section 3.8.2 (see Mitigating for Lack of Mycorrhizal Fungi) covers methods beneficial for establishing mycorrhizae.
Rooting Depth
Rooting depth is the distance from the surface of the soil to the lowest point that roots can penetrate. It encompasses any strata (e.g., topsoil, subsoil, and parent material) that can be accessed by plant roots. The deeper the rooting depth of a disturbed site, the greater the total available water storage and the higher the productivity of the site.
Rooting depth is affected by restrictive layers that block root penetration to lower strata (Section 3.8.5, see Mitigating for Steep Slope Gradients). For example, the rooting depth of a post-construction site is estimated at 6 feet deep. However, further investigation finds that there is a highly-compacted layer at 12 inches, which would limit most, if not all, root penetration below that point. The rooting depth under these conditions has been reduced to only 1 foot of soil instead of 6 feet. Restrictive layers also include soils with very high or very low pH, toxic materials, or a high-water table.
Rooting depths vary by plant species and age of the vegetation. Most mature tree species have deep root systems that access subsoil and parent material; roots of grasses and forbs are predominantly limited to surface soils. Annual grasses and forbs need less rooting depth than perennial grasses and forbs, with the roots of these species growing in the upper surfaces of the soil. The age of the vegetation also determines the abundance and location of roots. Newly established seedlings have shallow roots but, as the plants mature, root systems expand to access moisture deeper in the soil.
Rooting patterns and root morphology play a role in how plants access soil water. Some species have finer-textured root systems that access tightly held soil moisture; other species have aggressive root systems that can penetrate deeply into cracks between rock fragments. Grasses, for instance, have shallower root systems than trees and shrubs, but their small size and high density in the surface soil gives them an advantage in shallow soils.
How to Assess Rooting Depth—Rooting depth should be estimated from reference sites during planning and post-construction, but it is not always an easy parameter to measure. Observing road cuts is often the best means to determine rooting depth. Rock type (e.g., granite, sandstone, and schist), fracturing patterns, rock weathering, and the degree of rock fracturing will provide an indication of rooting depth. Observing the amount and type of roots in the fractures of existing road cuts will give a good idea of rooting depth.
Fracturing and weathering of rock can also be determined from geotechnical analysis. If the bedrock has been drilled, the drill log report can provide an indication of degree and depth of rock fracturing and weathering. One way that rock quality is assessed is through a classification called the Rock Quality Designation Index (RQD). This system rates the bedrock by how much fracturing is observed in the cores. It is calculated by measuring the pieces of rock in the core sample that are longer than 10 cm, summing the length of these pieces, and dividing by the total length of the core (Deere and Deere 1988). A small RQD means that the bedrock is highly fractured whereas a high RQD means the bedrock is massive. A RQD may be poor from an engineering standpoint because of the high fractures, but favorable from a revegetation standpoint because cracks will hold some moisture and allow root penetration. A RQD rated as “very poor,” “poor,” and even “fair” should be somewhat favorable to root penetration.
Table 3-8 | Calculating total available water-holding capacity
The total available water-holding capacity (TAWHC) is the total amount of moisture that a soil can store for plant growth when fully charged with water. TAWHC values for each revegetation unit are helpful for determining which species will perform well and in develoPing the mitigating measures necessary to increase water-holding capacity or rooting depth. TAWHC is calculated by determining the texture, rock fragment content, and depth of each soil layer, and calculating how much water each layer will optimally store. The water- holding capacity of each soil layer is added together to obtain the TAWHC for the soil profile.
| Soil strata |
Data |
|
Soil characteristics |
Results |
Equations |
|
|
A
|
2
|
AWHC of texture (inches / foot)
|
2
|
From Figure 3-21 or lab results
|
|
|
B
|
20
|
Small Rock (%)
|
0.264
|
= A * ( B / 100 ) * 0.66
|
|
0 to 1’
|
C
|
5
|
Large Rock (%)
|
0.1
|
= A * ( C / 100 )
|
|
|
D
|
1
|
Thickness (ft)
|
1
|
Thickness of soil section
|
|
|
E
|
|
Available water by section
|
1.6
|
= ( A - B - C ) * D
|
|
|
F
|
2.2
|
AWHC of texture (inches / foot)
|
2.2
|
From Figure 3-21 or lab results
|
|
|
G
|
35
|
Small Rock (%)
|
0.5082
|
= F * ( G / 100 ) * 0.66
|
|
1 to 2’
|
H
|
25
|
Large Rock (%)
|
0.55
|
= F * ( H / 100 )
|
|
|
I
|
1
|
Thickness (ft)
|
1
|
Thickness of soil section
|
|
|
J
|
|
Available water by section
|
1.1
|
= ( F - G - H ) * I
|
|
|
K
|
2.2
|
AWHC of texture (inches / foot)
|
2.2
|
From Figure 3-21 or lab results
|
|
|
L
|
35
|
Small Rock (%)
|
0.5082
|
= K * ( L / 100 ) * 0.66
|
|
2 to 5’
|
M
|
70
|
Large Rock (%)
|
1.54
|
= K * ( M / 100 )
|
|
|
N
|
3
|
Thickness (ft)
|
3
|
Thickness of soil section
|
|
|
O
|
|
Available water by section
|
0.5
|
= ( K - L - M ) * N
|
|
Total available water holding capacity (inches)
|
3.2
|
= E + J + O
|
Rooting depth is also affected by the presence of a restrictive layer caused either naturally or by compaction. How to determine the presence of these layers is addressed in Section 3.8.2 (see Rooting Depth) and Section 3.8.5 (see Mitigating for Steep Slope Gradients).
The literature contains many references to defining the depth of soil needed to support different plant communities. For example, 18 inches of soil has been shown to support simple grassland ecosystems, but more diverse native grassland communities are reported to require up to 4 feet or more (Munshower 1994). These figures can be misleading if they are not put in the context of site climate and soil type. In many respects, it is more useful to state the TAWHC of a site rather than the rooting depth. The TAWHC is the total amount of moisture that a soil can store for plant growth when fully charged with water.
Table 3-8 shows how the TAWHC is calculated. Using the same format and equations, a similar spreadsheet can be created by copying the equations into the “Results” column. In this example, there is 1 foot of topsoil and 2 feet of subsoil over a highly-fractured basalt. The topsoil has a loam texture and available water-holding capacity of 2.0 inches (estimated from Figure 3-21 or obtained from lab results) but, because of the rock fragments, it is reduced by approximately 0.4 inch. The subsoil has a high water-holding capacity because of high clay content, but the available water-holding capacity is reduced by half due to rock. Highly fractured basalt is encountered at a depth of 2 feet, and it is estimated from the road cut that approximately 30 percent is actually fractured. Within these weathered fractures is a gravelly clay loam textured material storing approximately 0.5 inch of water. The TAWHC for this site would be the sum of all sections of soil (approximately 3.2 inches).
TAWHC is useful for comparing water relationships between revegetation units and reference sites. For example, the TAWHC for a post-construction soil is 3.6 inches compared to an adjacent reference site, which is 6 inches. If the desired future condition of the post-construction soil is to be similar to the adjacent reference site, then the TAWHC of 3.6 inches has to be increased upward toward 6 inches for the site to be capable of supporting the vegetative community occurring on the reference site. If this is not possible, then the DFC target needs to be changed to reflect the plant community that the soil can support.
Mitigating for Poor Rooting Depth
Increase Available Water-Holding Capacity—Improving the water-holding capacity of the existing soil will increase TAWHC. Mitigating measures discussed in Section 3.8.6 can be used to increase soil moisture.
Tillage—If restrictive layers due to compaction are encountered, deep tillage should be considered. Section 5.2.2 provides guidelines for deep tillage.
Apply Topsoil—Increasing rooting depth and TAWHC can be accomplished by applying topsoil (Section 5.2.4).
Planting Islands—Mitigating measures, such as applying topsoil, organic matter incorporation, deep tillage, and other measures that increase water-holding capacity, can be focused in strategic locations, such as planting islands. This will conserve materials and reduce costs (Section 5.2.8).
Blasting—Strategic blasting to shatter the parent material has been suggested as a possible means of increasing rooting depth (Claassen 2006).
Mycorrhizal Fungi
The discussion to this point has addressed the primary factors responsible for soil water storage (soil texture, rock, and rooting depth) and ease of a plant through its roots to reach this water (soil structure). In this section, the discussion turns to how plants increase the efficiency of accessing water through mycorrhizae. While mycorrhizae provide many other benefits to the site in addition to water enhancement, they are covered in depth in this section because of the importance of water to establishing vegetation on highly disturbed sites in the western United States.
 Figure 3-28 | Mycorrhizal fungi extend root systems
 - Mycorrhizal fungi can greatly increase the surface area of the root system. The ectomycorrhizal fungi attached to the pine root system (A) comprise most of the absorptive surface shown in this photograph. The mycorrhizae include brown branched structures (B) and white hyphae or filaments (C).
Photo credit: Mike Amaranthus, Mycorrhizal Applications Inc
Mycorrhiza is the unique symbiotic relationship between fungi (called mycorrhizal fungi) and host plants. To the naked eye, many mycorrhizal fungi appear as a fine web or netting that seems to connect the root system to the surrounding soil (Figure 3-28), and in essence, this is exactly what is occurring. The extremely small hyphae of the mycorrhizal fungi are actually taking on the form and function of an extended root. Because mycorrhizal hyphae are up to five times smaller, they are able to access spaces in the soil not easily accessible by larger plant roots. Mycorrhizal hyphae not only provide the plant with greater access to soil moisture and nutrients, they also surround and protect roots from soil pathogens. In return, the host plant supplies carbohydrates to keep the mycorrhizal fungi alive.
Mycorrhizae play a critical role in site restoration by building soil structure. Hyphae and water stable organic “glues,” such glomalin, are excreted by the mycorrhizal fungi and bind soil particles together into aggregates. These aggregates stabilize the soil (Section 3.8.6, see Soil Strength) and are important for good air exchange and water permeability. This basic soil building process, or repair, facilitates the creation of nutrient reserves and nutrient cycling essential for restoring ecosystems (Miller and Jastrow 1992). Mycorrhizal fungi can also improve survival of tree and grass seedlings (Steinfeld et al 2003; Amaranthus and Steinfeld 2005). A healthy population of mycorrhizal fungi has also been shown to increase plant biomass and cover (Wilson et al 1991; Brejda et al 1993; Sobek et al 2000), and increase the diversity of native species (Smith et al 1998; Charvat et al 2000).
Ninety percent of all terrestrial plants form symbiotic relationships with mycorrhizal fungi. Of the thousands of known species, most generally fall into two categories—ectomycorrhizal fungi and arbuscular mycorrhiza fungi.
Arbuscular mycorrhizal fungi (AMF), formerly called endomycorrhizae, are the most commonly occurring mycorrhizal fungi, forming on 75 to 85 percent of plant species. These include legumes, composites, grasses, bulbs, most shrubs, and ferns. In addition, AMF occur on many tree species, including redwoods and some cedars, and many types of tropical trees. AMF grow inside the roots of the host plant and extend hyphae out into the soil. These fungi are more general in their association with plant species, meaning that one mycorrhizal species can form an association with a broad spectrum of plant species. AMF reproduce in two ways: by forming single spores outside of the root and from fungal structures (vesicles and hyphae) present inside a colonized root system. Arbuscular mycorrhizal fungi do not disperse their spores in the wind, but instead are dispersed from root to root or by animals. For this reason, recolonization of drastically disturbed sites by arbuscular mycorrhizal fungi can be slow, especially if there are limited sources of healthy, undisturbed soils nearby to repopulate the site.
Unlike arbuscular mycorrhiza fungi, ectomycorrhizal fungi, as the name implies, coat the outside of the roots with hyphae that extend out into the soil. Ectomycorrhizal fungi form on 5 to 10 percent of plant species, the majority of which are forest trees in the western United States. Species include Douglas-fir, western larch, true firs, spruce, hemlock, oak, manzanita, willows, and cottonwood. These fungi form a netting of fine hyphae around the root system that is often observable on nursery produced seedlings inoculated with mycorrhizal spores. Unlike AMF, the relationship between ectomycorrhizal fungi and host species is very specific. Many ectomycorrhizal fungi species have evolved to associate with only one plant species. Ectomycorrhizal fungi produce fruiting bodies, such as mushrooms, puffballs, and truffles, which yield reproductive spores for wind or animal dispersal.
AMF and ectomycorrhizae do not associate with all plant species. For instance, in the western United States, arbutoid mycorrhizae forms on manzanita and madrone, while huckleberry form ericoid mycorrhizae. Still another 10 to 15 percent of the plant species in the United States do not form mycorrhizae at all. Many of these plant species have evolved root systems that function similarly to mycorrhizae and therefore give them an advantage over many mycorrhizal plant species, especially during early plant establishment when mycorrhizae inoculum may be limiting. This advantage is why many plant species, considered highly aggressive weeds, are non-mycorrhizal species.
How to Assess Mycorrhizal Fungi—Where soils have been drastically disturbed, it can be assumed that the mycorrhizal fungal propagules are drastically reduced or absent from the site. The size and severity of the disturbance determine the diversity and quantity of mycorrhizal fungi. As the level of disturbance increases, the density of viable fungi propagules typically decreases. Small disturbances surrounded by native forests or rangelands often reestablish quickly; in larger disturbances, where topsoil has been removed, recolonization by mycorrhizal fungi may take years.
Some laboratories offer testing for mycorrhiza fungi, but these are expensive tests. Because it is unlikely that mycorrhizal fungi will be found in recently disturbed sites lacking topsoil, conducting these tests for most projects is unnecessary.
Mitigating for Lack of Mycorrhizal Fungi
For most construction projects, the management of mycorrhizae should be considered in the early stages of project planning. Several strategies are available to enhance mycorrhizal colonization.
Minimize Soil Disturbance—Operations that maintain topsoil will often preserve mycorrhizal inoculum and maintain soil nutrition. Partially disturbed topsoil is often adequate for reestablishing mycorrhizal plant species. Partial disturbances include clearing and grubbing of road right-of-way vegetation, ground-based logging, and light to moderate intensity burns. Colonized root systems left behind in these operations are sources of inoculum for endomycorrhizae.
Leave Undisturbed Areas—The movement of AMF into highly disturbed sites is slow. Spores are transported by soil erosion and animal movement but not by air. Leaving small areas of native vegetation and undisturbed soils within the larger disturbance reduces the travel distance of AMF, facilitating a quicker repopulation of the disturbed site. This practice is especially important where the size of the disturbance is large.
 Figure 3-29 | Non-mycorrhizae inoculated seedlings versus inoculated seedlings
 - The response of adding mycorrhizae spores to non-inoculated seedlings (right) can sometimes be dramatic. Both sets of sticky currant (Ribes viscosissimum) seedlings shown in this photograph were stunted for months after seed germination. AMF spores were applied to the surface of each seedling container on the left with immediate growth response, while those on the right without mycorrhizae remained stressed (photo taken 50 days after inoculation).
Photo credit: David Steinfeld
Salvage Topsoil—Salvaging topsoil and reapplying it to drastically disturbed sites is commonly done when quality native topsoil is available (Section 5.2.4). Topsoil obtained from non-forested sites, such as meadows, rangelands, and unforested clear-cuts, is typically high in AMF which is important for grass and forb establishment. Salvaged topsoil forested sites will have mycorrhizae suitable for tree species as well as grass and forbs.
Apply Topsoil to Planting Holes—If topsoil is very limiting, placing healthy topsoil into holes prior to planting seedlings is an effective method of introducing an inoculum to a disturbed site. Collecting soils as inoculum from young, actively growing forests has been shown to be suitable inoculum for young tree seedlings (Amaranthus and Perry 1987).
Apply Commercially Available Mycorrhizal Fungi Inoculums—Applying commercially available mycorrhizal fungi inoculum is another method used to repopulate highly disturbed sites (Section 5.2.7). Commercially available sources of mycorrhizal inoculums are available for ectomycorrhizal and AMF plant species. These inoculums can be applied in hydroseeding slurries, as seed coats and root dips, through irrigation systems, or incorporated into the soil by broadcasting or banding. Fine grades of mycorrhizal inoculum are applied to the surface of the soil and will move into the soil surface with rainfall. To make them effective, incorporate coarser-textured commercial inoculums in the soil. When purchasing live plants from a nursery, rooting media can be inoculated with mycorrhizal fungi during nursery culture (Figure 3-29).
Reduce Fertilizer Use—While the application of fertilizer can increase plant biomass in the short term, it can also suppress mycorrhizal infection (Jaspers et al 1979; Claassen and Zasoski 1994). However, at lower rates, fertilizers have been shown to help plant establishment and improve mycorrhizal colonization (Claassen and Zasoski 1994).
3.8.3 WATER LOSS
Water loss is the depletion of soil moisture through transpiration (loss of water through leaves/ needles) and evaporation of soil moisture from the soil surface. The rate at which evaporation and transpiration draw moisture from the soil profile is the evapotranspiration (ET) rate. ET rates change daily (rates rise through the day with increasing temperatures and winds speeds and decrease at night), weekly (as weather systems move through), and seasonally (rising in spring and summer and decreasing in fall and winter) (Figure 3-30).
The plant is a conduit for water transport between the atmosphere, which demands water from the plant, and the soil, which acts as a bank of water. When ET rates are low, plants can easily pull water from the soil through the leaves to the atmosphere. As soil moisture is de- pleted through time, there is less moisture to draw from and plants come under greater stress. With rising temperatures, lower humidity, and lack of rainfall, plants will be under very high moisture stress levels (Figure 3-31). The amount of stress that a plant is under is referred to as plant moisture stress (PMS)
(Figure 3-32). PMS is at its highest from middle through late summer in the western United States, when the ET rates are at their highest and soil moisture levels at their lowest.
Water loss due to ET can be influenced by a number of abiotic and biotic factors, primarily:
- Wind
- Site aspect
- Competing vegetation
- Humidity
- Soil cover
Wind
Wind is often overlooked as a factor in the success or failure of establishing native vegetation, but it can play a major role, especially on sites where summers are hot and dry and soil moisture levels are low. Until seedlings become established, wind can place extremely high demands for moisture on newly planted seedlings, severely limit growth, and ultimately lead to death. Wind can also be an important factor for surface stability, as discussed in Section 3.8.5.
How to Assess Wind—Wind speed equipment is available but is most likely too costly for most designers. Site visits during different times of the year, especially in the summer, can give some indication whether wind is a problem. Visiting the site during the afternoon is important because this is the time of day when hot, dry winds negatively affect plants the greatest. Other site characteristics, such as position on the slope (e.g., ridgelines are more prone than valley floor), or proximity to forested environments—as forests often reduce wind speeds—can be used to infer wind strengths and directions.
Mitigating for High Wind
Road Design—Designing islands of undisturbed vegetation to help break up wind patterns can aid vegetation establishment. The taller the plants left undisturbed, the greater the wind protection. Established trees, particularly those with low-growing branches, provide the greatest protection from wind.
Wind Barriers—Obstacles that block wind at the soil surface can be effective for early seedling survival. These obstacles can include trees and tall shrubs, shelterbelts, filter fabric, stabilized logs, large rocks, berms, and stumps. In using these structures, seedlings should be planted on the windward side.
Tree Shelters—Tree shelters completely surround seedlings and block them from the wind (Section 5.5.4). They are an effective means of reducing ET rates created by high winds during early establishment. Once the vegetation has emerged from the top of the tube, however, tree shelters no longer protect the emerging foliage from the wind.
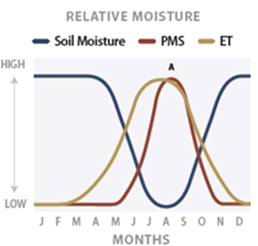 Figure 3-31 | Relationships among evapotranspiration, soil moisture, and plant moisture stress
 - Conceptual relationship between evapotranspiration (ET), soil moisture, and plant moisture stress (PMS). In the western United States, PMS lags behind ET in late spring because soil moisture is still moderate to high from the winter rains. By midsummer (A), plant moisture stress has increased to its greatest level in the year because soil moisture is at its lowest. Newly planted seedlings under- go extreme stress during this period. Unless the seedlings are dormant or their root systems have grown deeper into the soil, where there is greater access to soil moisture, seedlings will die. In late summer and early fall, cooler weather returns and rains wet the soil, driving ET and PMS rates down again.
Shade Cards—Shade cards are sometimes used to block wind, but they are less effective than the fully enclosed tree shelter (Section 5.5.3). When used to block wind, shade cards are placed on the windward side of the seedling, which is not necessarily the same location that cards would be placed if protection from sun is the objective. Often two shade cards are placed around the seedling for added protection against the wind. Placement of the shade cards at the height of the foliage affords greater protection to the seedling.
Appropriate Species Selection—The drying and damaging effects of wind are important considerations in appropriate species selection. A simple assessment of soil type and rainfall may not account for the effects of wind. Choosing hardier, wind-tolerant, and more drought-tolerant species may be necessary to establish vegetation on windswept sites. Find reference sites in windy locations to indicate which species are adapted to wind.
Leave Surface Roughened—A roughened soil surface can create a micro-basin or relief that protects young germinants from the drying effects of wind during the establishment phase (Section 5.2.2).
Aspect
Aspect is the direction a slope is facing and is one of the predominant site characteristics affecting evapotranspiration. South and west aspects receive more solar radiation during the day and are warmer and drier, with higher ETs than north and east aspects. Soils on these south and west aspects dry out faster than north and east slopes. In spring, during seed germination, south and west aspects can dry very quickly between rainstorms, reducing the rates of germinating seeds. As seedlings emerge and grow through spring and early summer, temperatures on the south and west slopes continue to rise to very high levels, creating very unfavorable conditions for seedling establishment. Even with planted seedlings, high surface temperatures can damage stems near the ground line, severely affecting seedling survival and establishment (Helgerson et al 1992).
In climates where moisture is not the limiting factor, south and west slopes are often very productive and have greater cover. Warmer soil and air temperatures create a longer growing season, offsetting the effects of moisture stress on plant growth.
On high elevation sites, north and east aspects are cool, with much shorter growing seasons, compared to the south and west aspects, resulting in very different compositions of species. At high elevations, soils on south and west slopes stay warmer longer in the fall, providing an opportunity to plant in the late summer in time for seedlings to become established before winter arrives. During spring, at all elevations, south and west slopes warm up much sooner than north slopes, resulting in earlier seed germination and plant growth. The difference in soil temperatures between north and south aspects is a consideration for determining when to plant and what species to use.
How to Assess Aspect—Aspect is measured in the field by facing the fall line of the slope (the imaginary line a ball would roll) and taking a compass bearing downslope. A “northeast slope,” “northeast aspect,” “northeast exposure,” or “northeast-facing slope” all refer to an aspect with a compass bearing facing northeast.
Aspect can also be measured from topographic maps by drawing an arrow perpendicular to the contour lines and pointing the tip of the arrow downslope. Aspect is often a factor for delineating one revegetation unit from another due to the strong influence it has on the growth and survival of seeds, seedlings, and cuttings.
Soil and air temperatures differ greatly between aspects, and taking temperature measurements can be important for assessing the effects of aspect on revegetation. There are many types of recording devices available on the market, but only equipment that can download data to spreadsheets for analysis and graphing should be considered. Some equipment has become so inexpensive that more than one unit can be purchased (Figure 3-33).
Mitigating for South and West Aspects
For most sites, any treatment that will shade vegetation on the south and west slopes from intense solar radiation should increase survival and growth of establishing plants.
 Figure 3-33 | Temperature recording device
 - Temperature recording technology has become smaller and very inexpensive. The iButton® shown next to the nickel can record more than a year of temperature data.
Photo credit: David Steinfeld
Overstory Vegetation—Keeping overstory trees at a minimum density of one tree per tenth acre is a rule of thumb for reducing soil temperatures below lethal levels on south aspects (Helgerson et al 1992).
Shade Cards—Shade cards can significantly increase seedling survival on south aspects (Hobbs 1982; Flint and Childs 1984) (Section 5.5.3). Placing them close to planted seedlings so that the stem and lower portion of the seedlings are shaded from the afternoon sun maximizes their effectiveness (Helgerson et al 1992).
Obstacles—Large obstacles that cast significant amounts of shade on young seedlings will create a more favorable environment for seedling establishment and increase seedling survival (Minore 1971). These include stabilized logs, large rocks, berms, and stumps. Seedlings should be planted on the north and east side of these features to be shaded from the afternoon sun.
Mulch—On south exposures, the use of mulches as a moisture barrier should be considered for seedlings, seeds, and cuttings (Section 5.2.3). Avoid placing mulch in direct contact with the stem of the seedling.
Species Mix—The composition of species will probably be different for north and south aspects. Species adapted to hotter and drier environments are used for revegetating south exposures; those adapted to cool, moist environments are used on north aspects. Elevation can offset the effects of aspect. For example, species that grow on low elevation, north aspects often occur several thousand feet higher on south aspects because of the difference in temperatures. Reference site vegetation surveys will guide in the selection of appropriate species for each exposure.
Plant Material Rates—South aspects often require a higher density of seedlings, cuttings, and seeds than north aspects to offset the expected higher mortality rates. Adjusting for increased mortality rates is made when calculating plant materials rate for seeds (Section 5.4.1), cuttings (Section 5.3.5), and plants (Section 5.3.6).
Planting and Sowing Windows—Take advantage of warmer spring and fall soil temperatures on the south exposures by sowing and planting earlier on these sites (Section 3.14.2).
Competing Vegetation
Controlling competing vegetation around planted seedlings, whether native or non-native, reduces the rate at which water is withdrawn from the root zone and increases the potential for survival and growth. The rate at which water is depleted is a function of the type and amount of competing species. Grass species, for example, have a very fibrous root system in the upper soil horizon that allows them to withdraw moisture very quickly and efficiently during dry weather. Unless grasses are controlled, especially in the western United States, it is very difficult to achieve good survival or growth of planted seedlings in areas with high densities of grass. Perennial forbs are generally less competitive than grasses because their root systems are deeper and less concentrated in the surface where the seedlings are withdrawing moisture.
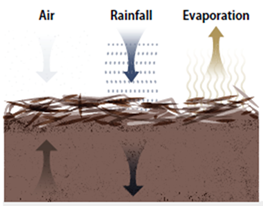 Figure 3-34 | Plant moisture stress
 - Plant moisture stress (PMS) is a measure of the tension or pull of moisture through a vascular plant. Much like a straw, when the demand for moisture at the surface of leaves is high, moisture is drawn from the stomata. This creates a pull of water through the leaves, stem, and down to the roots, which draws water from the soil.
Revegetating with a seed mix is also affected by the type and quantity of competing vegetation. Those species that germinate earlier than the seeded species in the spring or fall will deplete soil moisture before the seeded species can establish. Cheatgrass is an example of an annual species that establishes quickly when soil temperatures are cool during early spring, depleting the surface soil moisture just as perennial species are beginning to germinate. How to assess and mitigate for competing vegetation is discussed in detail in Section 3.11.
Soil Cover
The thickness and composition of material that covers the soil surface influence many import- ant soil properties covered in this manual, such as infiltration rates, interception losses, soil temperatures, surface erosion, runoff, and soil moisture loss. The following discussion focuses on soil cover as it affects soil moisture loss through evaporation.
Under undisturbed conditions, soil cover is predominantly composed of duff, litter, and stems that block the escape of soil moisture through evaporation (Figure 3-34). Mulches are also unfavorable seedbeds for weed seeds because duff and litter dry out quickly. Disturbed soils, on the other hand, are mostly composed of bare soil. Evaporation from the surface of bare soil can be high, extending to at least 6 inches below the soil surface, affecting seed germination and seedling establishment rates. Until roots of planted or seeded seedlings have extended farther into the soil profile, surface drying will negatively affect seedling establishment, especially on sites where water input and storage are already limiting.
How to Assess Soil Cover—Soil cover can be measured on undisturbed and disturbed reference sites or post-construction sites through the ground cover monitoring procedures outlined in Section 6.3.1. In this procedure, the percentage of area in litter, duff, rock, vegetation, and bare soil is recorded and periodic measurements of litter and duff thickness are made.
Mitigating for Low Soil Cover
Mulches for Seedlings and Cuttings—Mulches create a more favorable environment for establishing seedlings and cuttings not only by reducing surface evaporation, but also by decreasing the amount of competing vegetation. There are three types of mulches for seedlings and cuttings—organic aggregate, sheet mulches, and rock mulches. The organic aggregates are thickly applied ground wood or bark, while the sheet mulches are made from non-permeable or slightly permeable plastic, newspaper, or geotextile. Rock mulches are composed of gravels, cobbles and stone. Mulches are placed around the base of the seedling and cover at least a radius of 1.5 feet from the base of the seedling (Section 5.2.3 for how to install).
Mulches for Sown Seeds—Selecting and applying mulches over sown seeds differ from those selected for planted seedlings and cuttings. Mulch application for seedlings and cuttings is typically too thick for seeds to germinate and grow through. An ideal seedbed mulch is one that is applied at the highest rates without affecting seedling emergence. Long-fibered mulches, such as straw, hay, shredded wood, or wood strands, create the greatest loft or thickness. At the optimum thickness, these mulches allow some light to penetrate and space for seedlings to emerge. Short-fibered mulches, such as wood fiber and paper found in hydromulch products, are more compact and create less loft. While these products reduce erosion rates, they are not necessarily good as seed covers (Section 5.4.2).
3.8.4 NUTRIENT CYCLING
Nutrient cycling is the process by which sites store and release essential nutrients for plant survival and growth. There are 13 elements, or mineral nutrients, and each fills a specific role or function in plant development and each possesses individual characteristics of movement and storage in the soil. This manual will not attempt to explain the role and function of each mineral nutrient (there are many good textbooks on this subject). It will instead focus on how nutrients cycle through vegetation and soils; how they are captured, stored, and released; and what site components are essential to support these processes. In contrast to an agricultural system of managing optimum growth in crops through fertilization, the goal in wildlands revegetation is to create an environment that will support a self-sustaining native plant community that can develop through successional processes. This includes facilitating the establishment of nutrient cycles in a way that conserves, cycles, and builds nutrients in the system.
Mineral nutrients are stored in: soil, live or dead vegetation, and rock. They are slowly released over time at varying rates. The rates at which nutrients are released from each source will determine their availability for plant uptake. Rock and fallen trees, for example, both hold essential nutrients but release them to the soil at significantly differing rates. The fallen tree can take up to 100 years to decompose and release its nutrients; the weathering of rock might take over 100,000 years. Soil, on the other hand, can release nutrients in the order of weeks and months. Once released, these nutrients are taken up by plants, lost through leaching or erosion, or reabsorbed in the soil.
On undisturbed sites, there is a dynamic exchange of nutrients throughout the year. Plants absorb nutrients from the soil through the root system and assimilate them into vegetative biomass. As plants, or portions of plants, die, they drop leaves, branches, and stems to the ground where they eventually decompose and return nutrients to the soil. The nutrients are stored in the soil and once again become available for plant uptake. This natural process of nutrients moving from soil to vegetation and back again is referred to as nutrient cycling. The factors important in nutrient cycling are as follows:
- Topsoil
- Site organic matter
- Soil nitrogen and carbon
- Nutrients
- pH
- Salts
In a healthy plant community, nutrients are constantly recycled with a minimum amount of nutrients lost from the site. On drastically disturbed sites, however, nutrient cycling functions poorly, if at all. The topsoil, which holds the greatest concentrations of available nutrients and supports the primary microbial activity on the site, is missing or mixed with the subsoil. Organic matter, which is a primary source of long-term nutrient supply and an energy source, has also been removed. Soil nitrogen, the most critical nutrient for plant growth and site revegetation, is lacking. Soil nitrogen governs how quickly vegetation will return to a disturbed site and how much biomass it will ultimately support (Bloomfield et al 1982). Its availability is closely regulated by the amount of carbon present in the soil, which is also in flux on highly disturbed sites.
For many sites that lack topsoil, the subsoil in its place may have pH values that are higher or lower than the pH of the original topsoil. pH values at extreme ranges affect nutrient cycling by making many nutrients insoluble and unavailable for plant uptake. In addition, increased soil salinity, which can be caused by soil disturbance and amendments, can disrupt nutrient availability and provide unfavorable conditions for plant establishment.
Topsoil
The topsoil is the horizon directly below the litter layer that is characterized by high organ- ic matter, abundant roots, healthy microbial activity, good infiltration rates, high porosity, high nutrient content, and high water-holding capacity (Jackson et al 1988; Claassen and Zasoski 1998). Most nutrient cycling takes place in the topsoil where the greatest biological activity occurs. Decomposing microorganisms flourish, feasting on dead vegetation and roots, releasing stored nutrients back to the soil. Most life forms occur in forest, prairie, and range top- soils, including mammals, reptiles, amphibians, snails, earthworms, insects, nematodes, algae, fungi, viruses, bacteria, actinomycetes, and protozoa (Trappe and Bollen 1981). The top 6 inches of an acre of forest topsoil can contain as much as a ton of fungi and a half of a ton of bacteria and actinomycetes apiece (Bollen 1974). Topsoil depth is highly correlated with the nutritional status of the soil and, in forests of the western United States, has been found to be highly correlated to site productivity (Steinbrenner 1981). Topsoils possess humus, which is what gives topsoils their dark color (Figure 3-35). Humus is a stable end-product of decomposition, important for nutrient storage, soil structure, and water-holding capacity.
Sites lacking topsoil have significantly reduced productivity, and obtaining even minimal revegetation can be very difficult. Planted seedlings often fail or growth is significantly reduced, resulting in inadequate plant cover to protect the soils from erosion. Growth of planted trees can be reduced by one-third to one-half when planted in subsoil instead of topsoil (Youngberg 1981). Restoring these sites to functioning plant communities is unlikely without mitigating measures.
How to Assess Topsoil—On undisturbed sites, topsoil is visually differentiated from the underlying subsoil by having darker colors, less clay, better soil structure, and higher abundance of fine roots. In forest soils, topsoil depths can be more difficult to differentiate from subsoils because the color changes are not always distinct. Other attributes, such as the abundance of roots, lack of clays, soil structure, and lower bulk density, can be used instead. On construction sites, topsoil has either been removed and stockpiled or mixed in with the subsoil.
Mitigating for Lack of Topsoil
Minimize Soil Disturbance on “Fragile Soils”—Where soils are especially fragile and reconstructing topsoil conditions is difficult, it is particularly important to keep the “disturbance footprint” to a minimum (Claassen et al 1995). Sites with fragile soils include decomposed granitic soils, serpentine soils, high elevation soils, and very acidic or basic soils.
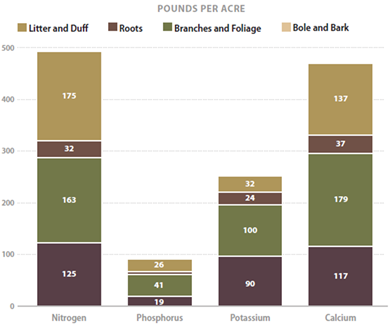 Figure 3-36 | Nutrients in forests stands
 - Most of the nutrients found in a young Douglas-fir stand reside in the litter, duff, and branches (adapted from Cole and Johnson 1981).
Salvage and Reapply Topsoil—An effective practice in revegetating highly disturbed sites is salvaging and reapplying topsoils (Section 5.2.4). This practice has been found to greatly increase plant growth and ground cover (Claassen and Zasoski 1994). Topsoil salvage and application require good planning, implementation oversight, and topsoil surveys. In the planning phase, a survey of the planned road corridor identifies the location of topsoil, the depth, and nutrient status through laboratory testing (Section 3.8.4, see Topsoil). After topsoil is removed and appropriately stored, it is reapplied to the disturbed site, ideally at depths similar to pre-disturbance reference sites.
Create Manufactured Topsoil—When topsoil is not available, “manufactured topsoil” can be created in situ or produced offsite and imported (Section 5.2.4, see Manufactured Topsoil). Manufactured topsoil will lack the native seed bank and some of the biological components of topsoil, but it can re-create a rooting zone high in nutrients and organic matter, with good water-holding capacity, porosity, and infiltration.
Create Planting Islands—If sources of manufactured or natural topsoil are scarce or too costly for broad scale applications, placing available topsoil in strategic locations, such as planting islands, can create a mosaic of productive growing sites.
Site Organic Matter
Site organic matter (OM) consists of plant materials in all stages of decomposition, including wood, bark, roots, branches, needles, leaves, duff, litter, and soil organisms. From a nutrient cycling standpoint, site organic matter assimilates nutrients drawn from the soil into live vegetation. Depending on the type of vegetation and the productivity of the site, the amount of nutrients held in organic matter can be significant. Figure 3-36 shows the quantities of four major nutrients held in the organic matter of a young Douglas-fir stand, and Figure 3-37 shows the quantity of major nutrients found in the application of 2 inches of material derived from Douglas-fir and alder. These two examples show the possible nutrient reserves that organic matter can contribute to a disturbed site if they are kept on the site or processed into mulch or soil amendments and reapplied.
While plants are essential in nutrient cycling, equally important are the decomposing organisms that release nutrients to the soil. Decomposers consist of thousands of specialized species of animals, insects, fungi, bacteria, and actinomycetes that survive on organic matter. Decomposing organisms not only release nutrients but are essential to the development of soil structure (Section 3.8.2, see Soil Structure).
On an undisturbed site, organic matter is in all stages of decomposition, from recently dead trees to soil humus, the end product of hundreds of years of decomposition. This understanding is important for restoring a site to a functioning plant community because it is a reminder that nutrients are released throughout the life cycle of a plant community, not just at the beginning of a revegetation project. A site that has a range of organic matter in all stages of decomposition not only conserves nutrients but slowly meters them out over time. In addition, organic matter is an essential nesting habitat for many pollinator species. For example, tunnel-nesting bees nest in dead standing trees or piths of stems and twigs of shrubs, grasses, and forbs.
The rate at which organic matter decomposes and releases nutrients is a function of: soil to OM contact, OM particle size, the ratio of carbon to nitrogen (C:N ratio), temperature, and moisture. Decomposition rates of organic matter are highest in soil because the greatest microbial activity occurs when soil is in direct contact with OM (Slick and Curtis 1985; Rose et al 1995). Organic matter placed on the surface of the soil as mulch will decompose at a much slower rate than organic matter incorporated into the soil because there is less contact with the soil.
Organic matter particle size plays an important role in the rate of decomposition. Within the soil profile, the smaller-sized OM fractions decompose faster than the larger fractions due to greater surface area in contact with soil. Roots, leaves, needles, and very finely ground sawdust or bark often decompose much faster than larger materials, such as buried logs or large diameter branches. Materials with C:N ratios, such as wood or bark, decompose much slower than materials with low C:N ratios, such as green leaves and grass cuttings. As Figure 3-38 illustrates, high C:N organic matter will take much longer to decompose than low C:N material, but both will decompose faster when they are reduced in size.
Moisture and temperature also control decomposition rates; cold and dry environments have very slow rates compared to warm, moist sites.
How to Assess Organic Matter—Duff and litter on reference sites can be measured through transects or plots (Section 5.2.3, see Litter and Duff). Estimating forest biomass of down, woody materials in different size classes can be done using photo series guides (Maxwell and Ward 1976a, 1976b, 1979). Fire specialists are experienced in estimating the amount of biomass in forested environments.
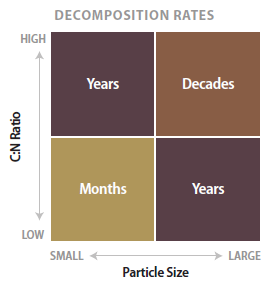 Figure 3-38 | Relative rates of decomposition by C:N ratio and particle size
Mitigating for Lack of Site Organic Matter
Salvage and Reapply Litter and Duff—Duff and litter can store a significant amount of nutrients, especially on sites where layers are deep. It can be salvaged separately (Section 5.2.3, see Litter and Duff) or mixed together when topsoils are salvaged (Section 5.2.4).
Process and Apply Organic Matter—Road projects constructed through forested sites can generate high amounts of biomass. These materials can be good sources for slow-release nutrients and carbon. Methods of processing this material and reapplying it to constructed slopes are discussed in Section 5.2.3 (see Litter and Duff). Processed organic matter can be applied directly to the soil surface as a mulch or mixed into the soil as a soil amendment. High C:N organic materials, such as sawdust and bark, can be placed on the soil surface to prevent long-term nitrogen tie-up in the soil or composted for several years to lower the C:N ratio before adding as a soil amendment. Lower C:N materials, such as leaves, needles, and branches, can be incorporated in the soil with some addition of slow-release nitrogen to reduce the effects of nitrogen tie-up.
Apply Composts to Soil Surface—When compost is applied to the surface of the soil (compost blanket), it functions as a soil cover to protect the soil from surface erosion while slowly decomposing and adding nutrients as the plant community develops. Decomposition rates of surface-applied compost are slower than if it were incorporated into the soil because there is very little soil contact at the soil surface. Nutrients are released at a slower rate and are available to the site longer. Leaving the soil surface very rough prior to the application of compost creates more soil-to-compost contact, which can increase the rate of decomposition of the compost. Tackifiers are added to compost to reduce the potential for the material to move off the site. Compost blankets function very differently than mulches; compost blankets are great media for seed germination and plant establishment whereas mulches are not (Section 5.2.3).
Salvage and Place Large Wood—Large wood can be salvaged and placed in areas such as abandoned roads for long-term site productivity, microsite planting, pollinator nesting habitat, and soil erosion control structures (Figure 3-39). When placed in contact with the soil, large wood helps stabilize the surface of the soil from sheet and wind erosion, and can be used as buttresses to stabilize slopes. Seedlings planted on the north side of the logs can be protected from wind and sun during establishment. Large and small wood can be placed at the outlets of culverts as obstacles to capture and store sediments, reducing the amount of sediment reaching live streams (Burroughs and King 1989; Ketcheson and Megahan 1996). When large wood is placed upright, it can be used as barriers to off-road vehicle traffic, nesting habitat for many pollinator species, and feeding and nesting habitat for a range of wildlife species.
Soil Nitrogen and Carbon
Nitrogen (N) is discussed separately from the other mineral nutrients because of its critical importance to plant growth and long-term development of plant communities. Carbon (C) is included in this discussion because of its unique relationship to nitrogen availability. Carbon governs the amount of available nitrogen in the soil while nitrogen regulates the rate at which carbon is broken down. Both factors play a critical role in microbiological activity and the development of soil properties.
Carbon to Nitrogen Ratio (C:N Ratios)—Carbon is the energy source for soil microorgan- isms, and practically all site nitrogen eventually passes through these microorganisms (Woodmansee et al 1978). The rate at which carbon (or organic matter) decomposes is directly related to the amount of available nitrogen and the type of dominant microbes present in the soil. The greater the nitrogen, the greater the decomposition rates. If decomposing organisms do not find sufficient nitrogen in the organic matter, they will withdraw it from the soil, leaving little or no nitrogen for plant growth. This is usually a temporary condition but could last several years. The tie-up of nitro- gen can greatly affect the establishment of vegetation if organic amendments, such as wood chips, are incorporated into the soil without supplemental nitrogen.
With time, nitrogen is eventually released from the organic matter by microbial activity. This nitrogen, plus nitrogen released from dead and decomposing microorganisms, becomes available for plant growth. As organic matter breaks down further, there becomes a net increase in available nitrogen. In the last stage of decomposition, microorganisms move to a steady rate of decomposition, releasing a constant nitrogen supply (Figure 3-40). This process can take several years or more depending on site factors and organic matter levels. The C:N ratio is an indicator of whether nitrogen will be limiting or in surplus. A C:N ratio of 30:1 or greater indicates that decomposing organisms have consumed the available nitrogen in the soil, leaving little if any available nitrogen for plant growth. Plants respond by turning yellow and stunted. A C:N ratio below 18:1 is an indication that the decomposing organisms are releasing available nitrogen from the breakdown of organic matter at rates that exceed their need, thereby increasing nitrogen for plant uptake (Claassen 2006). For example, undisturbed topsoils typically have ratios of 10:1 to 12:1, which indicates that nitrogen is sufficiently available for plant growth (Tisdale and Nelson 1975). Dry hay, on the other hand, has a C:N ratio around 40:1, indicating nitrogen will probably be limiting for some period of time if the hay is incorporated into the soil.
The use of high C:N materials is often discouraged because of concerns about tying up nitrogen. However, there are strategies where the use of high C:N materials can aid in achieving project goals. One use of high C:N materials is to apply it to the soil surface or incorporate it into the top several inches of soil to intentionally tie up nitrogen. The lower availability of N at the surface creates a less than optimum growing environment for the establishment of annual weedy species, which thrive on high nitrogen environments.
Soil Nitrogen Capital
Soil nitrogen capital can be categorized into three nitrogen pools, or reserves, based on its availability in the soil:
- Available nitrogen (referred to as “extractable nitrogen”)
- Slowly available nitrogen (referred to as “mineralizable nitrogen”)
- Unavailable nitrogen (“humified organic” or “fresh” forms)
Nitrogen capital can be viewed much like our banking sy stem. Cash received from the bank teller is comparable to “available nitrogen.” When money runs low, the teller replenishes it with money from the bank vault (similar to “slowly available nitrogen”). Banks are backed up by money held in an extremely large banking reserve system (“unavailable nitrogen”). While this money is not accessible, it is very important for the long-term stability of the banking system. Unavailable nitrogen is like the banking reserve system in that it backs up the nitrogen system and ultimately releases nitrogen to the plant community.
As with the banking reserve system, having high reserves of both slowly available and unavailable nitrogen ensures that available nitrogen levels will be released at constant rates over time which is necessary for the development of a sustainable plant community. Figure 3-41 shows the relationship of different revegetation treatments on nitrogen capital.
On highly disturbed sites, all nitrogen reserves are low. The course of action in typical revegetation projects is to apply inorganic fertilizers during the seeding operation. While this immediately makes nitrogen available, it does little for increasing long-term nitrogen reserves. Within a year of application, most soils will need more available nitrogen to sustain plant growth. Alternatively, organic fertilizers provide a combination of available and slowly available nitrogen. These fertilizers release nitrogen over several years but are typically applied at rates not great enough to bring the nitrogen reserves up to levels for long-term plant community establishment (Claassen and Hogan 1998). Applying topsoil, composts, or low C:N organic matter into the soil are mitigation treatments that create the reserves of unavailable and slowly available nitrogen important for a constant supply of available nitrogen over time.
Minimum Soil Nitrogen Levels
Total soil nitrogen is the sum of available, slowly available, and unavailable nitrogen reserves. The level of total soil nitrogen varies by plant community and ecoregion. It can range from 20,000 lb/ac in deep forest soils of the Washington and Oregon coast (Heilman 1981) to as low as 800 lb/ac in desert grasslands of southern New Mexico (Reeder and Sabey 1987). Shortgrass prairies in northeastern Colorado and shrub-steppe prairies of the Great Basin have a range of total nitrogen from 4,000 to 5,000 lb/ac (Reeder and Sabey 1987). Sites that are drastically disturbed often have nitrogen rates below 700 lb/ac. These sites cannot fully support vegetative cover. A minimum, or threshold, level of total soil nitrogen required for a self-sustaining ecosystem has been suggested at 625 lb/ac (Bradshaw et al 1982) to 670 lb/ac (Dancer et al 1977) for drastically disturbed sites. But Claassen and Hogan (1998) suggest much higher rates might be necessary. In their research on granitic soils in the Lake Tahoe area, they found a good relationship between total soil nitrogen and the percentage of plant cover. Sites with greater than 40 percent ground cover contained at least 1,100 lb/ac total soil nitrogen in the surface foot of soil. This implies that to maintain a minimum of 40 percent plant cover, sites like these have to contain at least 1,100 lb/ac of nitrogen, with higher nitrogen levels necessary for higher plant cover (Figure 3-42).
Target levels for available nitrogen released annually from nitrogen sources for plant growth range from below 27 to 50 lb/ac (Munshower 1994). These are nitrogen levels that should be considered when calculating fertilizer rates (Section 5.2.1, see Determine Fertilizer Application Rates).
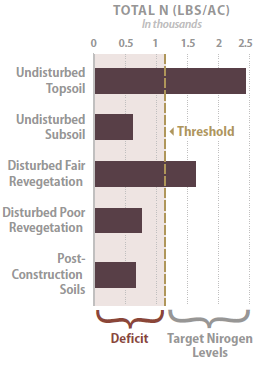 Figure 3-42 | Determining total N threshold values from reference sites
 - In this example, the total N threshold was estimated at 1,100 lb/ac (average of disturbed reference sites with “poor” and “fair” revegetation). Total N in post-construction soils was 650 lb/ac, making these soils deficient by 450 lb/ ac. The undisturbed topsoils of reference sites showed a total N of 2,430 lb/ac, which set the target levels of nitrogen between 1,100 and 2,430 lb/ac.
How to Assess Soil Nitrogen and Carbon—Soil testing for nitrogen can be conducted for: topsoils that will be salvaged, reference sites, and post-construction soil materials. Procedures for collecting soil samples are presented in Inset 3-2. The following nitrogen tests are available:
- Total nitrogen—Total nitrogen is an important test to request; the results will be used to determine nitrogen thresholds and nitrogen amendment needs. The common total nitrogen tests are Leco and Kjeldahl. Total nitrogen has been found to correlate well with plant cover (Claassen and Hogan 1998).
- Mineralizable nitrogen—This test requires the soil samples to be incubated for a period of time and then tested for available nitrogen. The results indicate the amount of slowly available nitrogen present in the sample. While this test is not widely used, it nevertheless is a very good test to perform because the results correlate well with expected plant cover (Claassen and Hogan 1998). There are several types of incubation tests, so it is good to confer with the soil laboratory as to which tests would be most appropriate.
- Extractable nitrogen—This test is less meaningful because it only indicates available nitrogen, not what is in reserve. This test is often included in a soil testing package. The extractable N pool has the lowest correlation to the amount of plant cover growing on a site (Claassen and Hogan 2002). The most common test for extractable nitrogen is 2N KCl extract.
Nitrogen testing for composts and organic matter should be done by laboratories specializing in these tests. These laboratories should follow the testing procedures outlined in the Test Methods of the Examination of Compost and Composting (TMECC) explained in Section 5.2.3 and Section 5.2.5.
Nitrogen Analysis—Soils laboratories report nitrogen in a variety of units, such as gr/l, ppm, mg/kg, ug/g, and percent. Unless these values are converted to pounds per acre, it is difficult to determine rates of fertilizer, compost, or topsoil necessary to restore site nitrogen. Use Table 3-9 (Line E) to convert lab values to total pounds per acre of nitrogen. These calculations account for soil bulk density, soil thickness, and coarse fragment content, which affect the total nitrogen levels of a site.
Nitrogen Thresholds and Deficits—Each plant community has a total nitrogen requirement it must meet in order to develop into a functioning and self-sustaining system. For successful revegetation efforts, a practical goal is to meet the minimum target, or threshold level, for total nitrogen. Threshold values, however, are not found in textbooks and are developed from soil tests of disturbed and undisturbed reference sites. Conducting nitrogen tests on disturbed reference sites where revegetation efforts have succeeded, as well as reference sites where revegetation efforts have failed, can help determine a threshold value (Figure 3-42). Alternatively, conducting soil tests on undisturbed reference sites will define the optimum nitrogen levels and also bracket target nitrogen levels. Converting soil test results into total nitrogen per acre is shown in Table 3-9, line E.
Post-construction soils are typically deficient in nitrogen. In order to develop a strategy for bringing soil nitrogen above threshold levels, it is important to determine the approximate nitrogen deficit. Table 3-9 shows how this is calculated by subtracting the total nitrogen value of post-construction soils (Line E) from the threshold nitrogen value (Line F).
Inset 3-2 | Soil testing
Soil testing is a means of describing those soil characteristics that cannot be observed or accurately measured in the field. The tests include analysis of chemical properties, including pH, soluble salts, macronutrients, micronutrients, and organic matter, as well as physical properties such as density, water-holding capacity, and texture. Soil testing is costly and if not sampled, analyzed, and interpreted properly can lead to unneeded and expensive soil amendments and application practices. In many respects, it is better not to test soils than to test them or interpret the results incorrectly. Some laboratory test results found for many soil series in the U.S. is available at the National Cooperative Soil Survey Soil Characterization Data website.
Soil testing is performed with topsoil recovery surveys and reference site surveys (discussed in other sections) to identify soil physical and chemical factors that will limit plant growth, develop site-specific soil quality targets, and develop a set of revegetation treatments that will increase short- and long-term soil productivity targets. The three components of soil testing are soil sampling, lab analysis, and interpretation of lab results. Adhering to an established procedure for each component of soil testing is critical for developing appropriate revegetation treatments.
Sampling soil—Soil sampling is the field collection of soils in a manner that best represents the soils of an area. The number of soil samples taken within a project area is usually kept to a minimum because of the expense of collecting and handling the samples and the cost of laboratory analysis. Taking too few samples to describe a project site, however, can be misleading, especially if the soils are extremely variable. This leaves the designer with the challenge of determining the best approach to collecting soil samples in a way that most accurately represents the sites being described.
The following guidelines are useful in developing a sampling strategy for soil testing:
- Determine the area to be sampled—The areas to be sampled are called sampling areas and they typically encompass a vegetation unit, an individual topsoil stockpile, similar topsoil salvage areas, or a reference site. For most projects, only one soil sample is collected from a sampling area. For this reason, it is important to select a collection site (an area where soil samples are collected) that best represents the sampling area. Only for small sampling areas, such as topsoil stockpiles or reference sites, will the collection site be the same as the sampling area. For larger sampling areas, such as revegetation units or topsoil salvage areas, the collection site will be a smaller, representative area within the sampling area.
- Collect multiple subsamples—Once a collection site has been identified, a set of subsamples are collected. Collecting soil from one point is never enough. The number of subsamples to collect within a collection site should be based on the site’s variability. Small collection sites generally need fewer subsamples than larger areas because these sites are usually less variable. Undisturbed sites are typically more homogenous than disturbed sites and therefore need fewer subsamples. Guidelines for the numbers of subsamples to collect range from 6 for very homogenous sites to 35 for large, heterogeneous sites.
- Randomly collect subsamples—Subsamples should be collected randomly within the collection site. For small areas like reference sites or stockpiled soil, the samples can be collected on a grid system. For very large areas, samples can be collected in a zigzag or “W” pattern at predetermined intervals.
- Determine sampling depth—The objectives for soil sampling are reviewed and the sampling depth is determined. If the objective is to characterize the soil for topsoil recovery, then the soil samples are collected only in the topsoil horizon, in which case the depth of the topsoil will have to be determined prior to sampling. If it is known that the surface soil including duff and litter will be removed to 15 inches during topsoil salvage, then collection depth would be a sample 15 inches deep that included the duff and litter layers. If soil sampling objectives are to determine the nutrient levels of a topsoil pile, the entire pile becomes the collection site and the subsamples are collected from various depths within the piles, as well as around the pile to obtain a representative sample. If the designer felt that the interior of the pile was significantly different in nutrient status or mycorrhizae, then the pile could be stratified into two collection sites—the exterior of the pile and the interior—and sampled separately. It may also be important to sample the subsoil because this will be the condition of the soil after construction and before mitigation.
- Collect a representative slice of soil—It is important to evenly sample the predetermined depth of soil. For example, if the sampling depth is 0 to 15 inches deep, then the entire section of soil is equally sampled for each subsample.
- Mix subsamples—Subsamples for a sampling area are placed in a clean bucket and mixed thoroughly. From the composite subsamples, the required amount of soil is removed to send to the lab for analysis.
- Determine coarse fragment content—If the soils are high in coarse fragments, the samples can be sieved in the field. If the soils are dry, a 2mm sieve can be used. This will reduce the amount of soil to haul out of the survey area and also give an estimate of the coarse fragment content. Soils can be sieved back at the office prior to sending to the lab. If the samples are wet or moist, they will need to be air dried prior to sieving. The percent coarse fragment content is recorded, which includes large and small coarse fragments. This information will be used later to modify the lab results.
- Selecting a lab—The criteria for selecting a soil lab is typically based on costs, turnaround time, analytical tests, and consulting services. Most labs offer pH, nutrients, nitrogen, and organic matter tests for under $80 per sample (2016 prices) and deliver the results within two weeks of receiving the soil samples. For an added fee, laboratories will interpret the results of the analysis. While these are important reasons for selecting a lab, the primary criteria for selecting a lab should be based on the quality of the testing facilities.
A common assumption is that all labs are of similar quality in their analytical testing, and that if a group of labs were sent the same soil sample they would report similar results for most tests. This is not typically the case, as several university reviews of laboratories have shown (Neufeld and Davison 2000; Rose 2004). In one comparison, eight reputable laboratories reported widely differing results for all soil nutrients when sent identical soil samples (Rose 2004). One reason for the variation in results is that usually several testing procedures can be used to quantify a soil parameter. Some methods have greater accuracy and precision than others. The soil testing industry at this time has not settled on an agreed upon set of analytical methods to use. Even when the same tests are performed, labs often report different levels of accuracy (Rose 2004).
Soil laboratories can voluntarily participate in the North American Proficiency Testing (NAPT) program that will assess the quality of their analytical procedures. In this program, NAPT periodically sends all participating labs identical soil samples. Each lab analyzes the samples for mineral nutrients using established analytical procedures, then sends the results back to NAPT. The results from all labs are compiled and analyzed statistically and each lab is sent a report on how their results compared to the other participating labs. NAPT suggest that the accuracy be less than 10 percent of industry values and precision no greater than 15 percent of industry values (Neufeld and Davison 2000). These reports are not available to the public, but laboratories might share them if asked. NAPT is not a certification program but is often a basis for a soil lab quality control program.
The following is a checklist for selecting a high-quality lab (modified from Neufeld and Davison 2000):
- Does the lab have a quality control program? If they do, ask them to explain it.
- Does it participate in a proficiency testing program (such as NAPT)?
- Will they share the results of proficiency testing program?
- Does the lab use established analytical methods (the most appropriate for soils in the geographic area being tested)?
If a “no” is given for the answers to any of these questions, another soil testing facility should be considered. If the selection is between a couple of labs, consider sending duplicate soil samples with known properties (“checks”) to each lab and compare the results using the NAPT suggested standards for accuracy and precision. Soil “checks” can be purchased through a proficiency testing program. Once a lab is selected, continue to ask for quality control reports. If the budget allows, periodically send duplicate “check” soil samples with regular soil samples to assess accuracy and precision.
Table 3-9 | Soil testing
| Parameter |
Source |
|
A
|
Total soil nitrogen (N)
|
0.025%
|
From soil test of post construction soils (if rates are expressed as gr/l, ppm, mg/kg, ug/g, divide by 10,000 to convert to percentage)
|
|
B
|
Thickness of soil layer
|
0.5 feet
|
The thickness of soil represented in (A).
|
|
C
|
Soil bulk density
|
1.4 gr/cc
|
Unless known, use 1.5 for compacted subsoils, 1.3 for undisturbed soils, 0.9 for light soils such as pumice
|
|
D
|
Fine soil fraction
|
70%
|
100% minus the rock fragment content (from estimates made from sieved soil prior to sending to lab)
|
|
E
|
N in soil layer
A * B * C * D * 270 =
|
331 lbs/ac
|
Calculated amount of total nitrogen in soil layer. To convert to kg/ha: E * 1.12
|
|
F
|
Minimum or threshold N levels
|
1,100 lbs/ac
|
Determined from reference sites or literature
|
|
G
|
N deficit: F - E =
|
769 bs/ac
|
Minimum amount of N to apply to bring up to threshold
|
Carbon Analysis—Carbon is determined directly using the combustion method (Leco instrument) or indirectly with the Walkley-Black and/or loss-on-ignition methods. Depending on the testing methods, carbon will either be reported as percent of organic matter or percent of carbon. To convert percent of organic matter to percent of carbon, multiply the value by 0.5 to 0.58 (Tisdale and Nelson 1975).
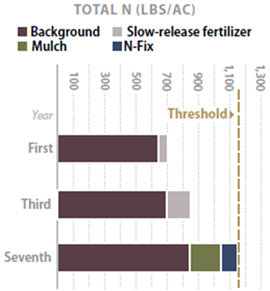 Figure 3-43 | Raising nitrogen levels
 - Raising nitrogen levels on nitrogen-deficient sites to threshold levels requires developing a long-term strategy. In this example, the site began with a background N of 650 lb/ac. After application of a slow-release fertilizer at 1,000 lb/ac during the first year, the site accumulated 50 lb N (assumes N was captured by plants or soil microorganisms and not leached from the soil). In the third year, an additional 3,000 lb slow-release fertilizer was applied, which increased total N to 850 lb/ac. By the seventh year, woody mulch that was applied during sowing had mostly decomposed, releasing approximately 200 lb N. Nitrogen-fixing plants were well established by then and had contributed approximately 100 lb N.
When soils laboratories receive soils samples, they sieve out any materials greater than 2 mm. For this reason, it is important to sieve rock fragments, but not larger organic matter, from the soil samples prior to sending them to the lab. Request that the lab not sieve the larger organic matter from the sample so that the results report out in total carbon and nitrogen.
C:N Ratio—The C:N ratio is calculated by dividing the percent of carbon by percent of nitrogen from the laboratory results obtained for nitrogen and carbon tests.
Mitigating for Low Soil Nitrogen
Develop a Strategy—It is important to develop a strategy for increasing nitrogen over time, especially on sites that are deficient in nitrogen. The strategy takes into account the accumulation of nitrogen by all available sources—topsoil, mulch, compost, fertilizers, and nitro- gen-fixing plants. Figure 3-43 shows an example of a strategy for increasing total soil nitrogen to a threshold level.
Topsoil—Salvaging and reapplying topsoil is an excellent way to increase total soil nitrogen on drastically disturbed sites. The depth to apply topsoil should be similar to the soil depth found in undisturbed reference sites or pre-construction soils. If topsoil material is limited, then using the calculations shown in Table 3-9 can help determine the minimum depths to apply topsoil. Section 5.2.4 discusses methods to salvage and apply topsoil. To determine if there is a tie-up or surplus of nitrogen in the salvaged topsoil, soil tests can be conducted for C:N ratios. Topsoils with C:N ratios greater than 25:1 could benefit from the addition of nitrogen, while ratios less than 8:1 will have the necessary nitrogen for plant growth.
Composts—Applied on the soil surface and incorporated, composts can supply sufficient soil nitrogen for long-term site needs. Application rates for composts can be calculated using the methods shown in Table 3-9. Testing and application methods for compost are discussed in Section 5.2.3 and Section 5.2.5.
Nitrogen-Fixing Plants—Significant quantities of nitrogen can be supplied by nitrogen-fixing plants (Section 5.2.7). Establishing nitrogen-fixing plants is a means of meeting short-term goals by reducing the need to apply fertilizers and long-term goals by increasing the total nitrogen on the site.
Fertilizers—Applying nitrogen-based fertilizers to drastically disturbed soils is another means of increasing nitrogen levels, but an understanding of fertilizers (composition and release), how the soils will capture and store nutrients, and how plants will respond to increased levels of available nitrogen is necessary. As the calculations in Table 3-9 demonstrate, nitrogen-based fertilizers cannot deliver enough nitrogen in one application for long-term site recovery of drastically disturbed sites. However, applied judiciously within an overall nitrogen strategy using topsoil, composts, and nitrogen-fixing plants, nitrogen-based fertilizers can be an effective tool in site recovery.
Not all sites or conditions require fertilizers. It might not be necessary to fertilize soils that have high total N levels and low C:N ratios. In fact, applying fast-release fertilizers may be a disadvantage on some sites by favoring weedy annuals over perennial species. A discussion on selecting fertilizers, calculating application rates, and determining methods of application is provided in Section 5.2.1.
Biosolids—Biosolids are rich in slow and fast releasing nitrogen and, if sources are available nearby, are a good means of raising soil nitrogen.
Nutrients
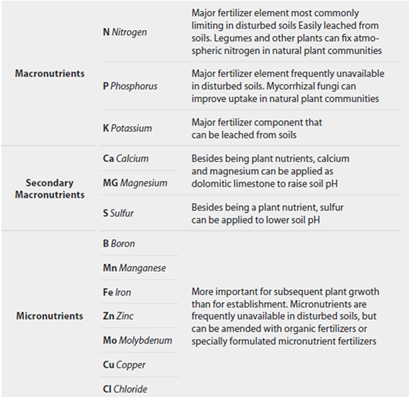 Figure 3-44 | The 13 essential mineral nutrients
 - Success in wildland restoration is determined by its species richness, not biomass production or whether it is a self-sustaining and resilient system, not a system that requires constant energy inputs. By these standards, applying the basic agricultural model to wildland revegetation is limited.
This section broadly discusses the remaining mineral nutrients essential for plant growth (Figure 3-44). There are many references devoted to the role of nutrients in plant nutrition and the designer is directed to these sources for a more detailed discussion of each nutrient (Tisdale and Nelson 1975; Thorup 1984; Munshower 1994; Havlin and others 1999; Claassen 2006) models. For example, from an agricultural perspective, a serpentine soil has an imbalance of calcium and magnesium. Unless fertilizers containing a “correct” ratio of calcium and magnesium are applied to adjust this imbalance, the soils will be unsuitable for crop species. In wildland restoration, the approach is guided by the nutrient needs of the species endemic to the site, not to a generic agricultural crop. Because serpentine plant species have evolved on soils with these nutrient ratios, their nutrient requirements are vastly different than those of agricultural crops, or even native vegetation growing on adjacent, non-serpentine soils. In this example, the calcium-to-magnesium ratio would not be an imbalance for native serpentine plant establishment, but perhaps as a “requirement” for certain endemic species to recolonize the site. This means the designer will need to compare post-construction mineral nutrient status to that of undisturbed or recovered reference sites to determine if there are deficiencies. Amendments can then be applied to bring nutrients and other soil factors to pre-disturbance levels or to levels that meet project revegetation objectives.
How to Assess Nutrients—The objective of nutrient analysis is to compare nutrient levels of post-construction, disturbed soils with those of pre-disturbance, or reference site, soils. Where there are large discrepancies, a strategy can be developed to bring low post-construction levels up to minimum nutrient levels. Because this is a comparative analysis, it is essential that the sampling, collection, and testing methods are identical.
Nutrient tests are often performed on salvaged topsoil, reference sites, post-construction slopes, and areas where there have been failures in revegetation. A guide to sampling soils for nutrient analysis is presented in Inset 3-2. Nutrient testing can be used to evaluate total soil.
Success in wildland restoration is determined by its species richness, not biomass production or whether it is a self-sustaining and resilient system, not a system that requires constant energy inputs. By these standards, applying the basic agricultural model to wildland revegetation is limited.
With soil laboratory results from reference sites and post-construction sites, determine which nutrients, if any, are deficient using the process outlined in Section 5.2.1 (see Develop Nutrient Thresholds and Determine Deficits). If a nutrient is found deficient, fertilizers, composts, topsoil, or other organic amendments can be applied to the soil to bring the nutrient above threshold levels. A process for determining fertilizer type, application rates, and application methods is presented in Section 5.2.1.
Mitigating for Low Nutrients
Topsoil—Salvaging and reapplying topsoil are important for restoring nutrients to pre-construction levels, especially on sensitive soils (e.g., serpentine and granitic soils). The depth to apply topsoil should be at levels found in undisturbed reference sites or pre-construction soils, or can be calculated by methods described in Figure 5-27 in Section 5.2.4.
Compost—Incorporating composts is a good method for increasing nutrients to pre-disturbance levels. Determining which type of compost to select and how much to apply is discussed in Section 5.2.5.
Fertilizers—As discussed in Section 3.8.4, fertilizers should be used within an overall nutrient strategy. See Section 5.2.1 for a discussion on application methods, fertilizer types, timing, and other important aspects of fertilization.
Biosolids—Biosolids are rich in nutrients. If sources are available and transportation economical, this is a good way to add nutrients to disturbed sites.
pH
pH (potential of hydrogen) is the measurement of soil acidity or alkalinity based on a logarithmic scale of 0 to 14. Soils with pH values below 7 are acidic, and those above 7 are basic. Basic soils have high amounts of bases (positively charged ions), such as calcium, magnesium, potassium, sodium, and phosphates. Basic soils have developed under arid and semi-arid climates and are found throughout the Basin and Range, Colorado Plateau, and portions of the Great Plains. Acidic soils have formed in wetter climates, where the continued movement of water through the soil profile leaches bases from the soil. Acidic soils are common in the eastern United States, the coast range and mountains of the Pacific Northwest, and the Gulf states (Figure 3-45). Topsoils are typically more neutral when compared to underlying subsoil, whether the soils are acidic or basic. In some cases, the topsoil buffers the plant root systems from the underlying, inhospitable subsoil conditions. When topsoils are removed during construction, subsoils become the growing environment and, unless mitigating measures are taken, plant establishment and productivity of the site is greatly reduced.
Soil acidity and alkalinity affects mineral nutrient availability, mineral toxicity (Palmer 1990), and nitro- gen fixation (Thorup 1984). In acid soils, the ability of plants to utilize many nutrients decreases, especially for calcium and magnesium. As soil pH becomes more acid (less than 4.5), aluminum becomes more soluble and more toxic to plant growth. Low pH soils also hinder the establishment of nitrogen-fixing plants, such as legumes (Bloomfield et al 1982). Significant loss of rhizobia viability has been documented at pH levels less than 6 (Brown et al 1982).
Table 3-10 | Soil testing methods
Common soil testing methods for the western United States (Horneck et al 1989; Munshower 1994; Teidemann and Lopez 2004). Note: Composts use a different set of tests due to high organic matter (Section 5.2.4 and Section 5.2.5).
| Tests |
Type |
Test Method |
Notes |
|
Boron
|
Available
|
Hot-Water
|
|
|
Boron
|
Available
|
Aqueous extract of a soil paste
|
|
|
Calcium, Magnesium
|
Available
|
Ammonium Acetate
|
|
|
Calcium, Magnesium
|
Available
|
Aqueous extract of a soil paste
|
In semi-arid to arid soils
|
|
Molybdenum
|
Available
|
Ammonium oxalate-oxi acid extraction
|
|
|
Nitrate
|
Available
|
Aqueous extract of a soil paste (Saturated paste)
|
Accepted extrant for western soils
|
|
Nitrate
|
Available
|
CaO extract & Cd reduction
|
|
|
Nitrogen (ammonium and nitrate)
|
Available
|
KCL Extraction
|
|
|
Nitrogen (mineralizable)
|
Slowly - Available
|
Anaerobic Incubation
|
|
|
Nitrogen (total)
|
Total
|
Kjeldahl N
|
|
|
Nitrogen (total)
|
Total
|
Combustion (Leco Instrument)
|
|
|
Organic matter
|
Total
|
Loss - Ignition
|
Best used for soil high in organic matter
|
|
Organic matter
|
Total
|
Walkley-Black Method
|
|
|
Organic matter
|
Total
|
Combustion (Leco Instrument)
|
Reports out in Total C
|
|
pH
|
Aqueous extract of a soil paste (saturated paste)
|
|
|
|
Phosphorus
|
Available
|
Olsen Sodium Bicarbonate
|
For arid and semi-arid soils
|
|
Phosphorus
|
Available
|
Dilute Acid-Flouride (Bray-P1)
|
For mesic sites
|
|
Phosphorus
|
Available
|
AB-DIPA
|
Reports out at half the rates of Olsen method
|
|
Potassium
|
Available
|
Sodium Acetate
|
|
|
Potassium
|
Available
|
Olsen Sodium Bicarbonate
|
For arid and semi-arid soils
|
|
Potassium
|
Available
|
Ammonium Acetate
|
|
|
Sodium
|
Available
|
Ammonium Acetate Displacement
|
|
|
Sodium
|
Available
|
CTPA
|
|
|
Sulfate Sulfur
|
Available
|
Aqueous extract of a soil paste (saturated paste)
|
|
|
Sulfate Sulfur
|
Available
|
CaHPO4 & ICP
|
|
|
Zinc, Copper, Manganese, Iron
|
Available
|
CTPA
|
Iron is not performed in Oregon because not found deficient
|
Soil with pH values of 8.0 or greater indicate the presence of calcium carbonate (Thomas 1967). Calcium and magnesium are at such high levels that they interfere with the uptake of other nutrients, notably phosphorus, iron, boron, copper, and zinc (Campbell et al 1980). High pH soils typically have high salt levels, which can also restrict the growth of many plants. For example, as soil pH approaches 9.0, sodium concentrations become toxic to plants (Tisdale and Nelson 1975).
How to Assess pH—The pH test is a standard analytical measurement that is typically run on soil samples sent for nutrient analysis. The pH test is also conducted on soil organic matter amendments considered for mulch or incorporation into the soil. The pH test is accurate, with values differing between laboratories by 0.1 to 0.2 points (Thomas 1967). pH can also be tested by the practitioner on site or back at the office using reasonably priced equipment. Most portable pH meters can measure soluble salts and this dual capacity is important in areas with high salts (Section 3.8.4, see pH). It is important when selecting a pH meter that is has a tip that can be submerged easily in a soil slurry.
The most accurate method of assessing pH is through lab analysis. However, quick, reliable estimates can be made with a hand-held pH/electrical conductivity meter using the Saturated Media Extract (SME) method for preparing samples (Figure 3-46). With this method, a small amount of soil (50 cc) is placed in a jar. Just enough distilled water is stirred into the soil to make the surface “glisten” but not readily flow. After the mixture rests for approximately 15 minutes the pH probe is inserted into the soil so that the sensors are completely covered and the pH reading is made.
Mitigating for Low pH Soils
Apply Liming Materials—Raising the pH through the application of liming materials is a common agricultural practice that can be applied to revegetating road sites (Section 5.2.6).
Apply Appropriate Fertilizers—Some commercial fertilizers, especially ammonium-based fertilizers such as ammonium nitrate, ammonium sulfate, and ammonium phosphate, will reduce pH (Havlin et al 1999) and should be limited on acidic soils. Fertilizers that have calcium, magnesium, or potassium in the formula are more appropriate for low pH soils. Examples of these fertilizers are calcium nitrate, potassium nitrate, and magnesium sulfate.
Apply Lime with Organic Matter—Incorporation of organic matter will lower pH. On acid soils, application of lime with organic matter will raise the pH of the soil (Section 5.2.6).
Apply Topsoil—Where topsoils have been removed leaving very basic or very acidic subsoils, reapplying topsoil or manufactured topsoil can moderate pH levels.
Mitigating for High pH Soils
Apply Organic Matter—Incorporated composts or other types of organic matter can lower soil pH as the organic matter decomposes (Havlin et al 1999). For arid sites, however, the pH and conductivity of the organic matter needs to be tested prior to purchase to avoid the possibility of introducing organic matter high in salts.
Add Nutrients—To compensate for the tie-up of certain nutrients, the addition of nutrients through fertilization may be considered; however, some of the benefits of using fertilizers on arid soil may be offset by the possibility of creating fertilizer salt problems.
Apply Sulfur—Agricultural soils can be treated with sulfur to lower pH, it is necessary to apply high quantities of sulfur and irrigation to lower the pH just slightly (Havlin et al 1999). The use of sulfur in roadside revegetation therefore is not a widely practiced method.
Irrigation
Applying irrigation water is another method of reducing soil pH by leaching out bases. However, the amount of water needed to lower pH levels can be very high; in most cases, using irrigation is not a viable mitigating measure on roadsides. It is also difficult to find irrigation water in arid environments that is low in bases and salts. Applying irrigation water that is high in bases will raise pH and salt levels in the soil, compounding the problem.
Salts
Soil salinity is the measure of the total amount of soluble salts in a soil. The term soluble salts refers to the inorganic soil constituents, or ions, that are dissolved in the soil water. The principal soluble salts in most soils contain the cations—sodium, calcium, and magnesium, and the anions chloride, sulfate, and bicarbonate (Landis and Steinfeld 1990).
Almost all plants are susceptible to salt injury under certain conditions, with germinants and young seedlings being particularly susceptible to high salt levels (Figure 3-47). Soluble salts can injure plants in several ways:
- Reduced soil moisture—Salts can lower the free energy of water molecules, causing an osmotic effect and thereby reducing the moisture availability to plants.
- Reduced soil permeability—High salt concentrations (specifically sodium salts) can change the soil structure by reducing the attraction of soil particles, causing them to disperse. Pore space is lost and air and water movement within the soil profile are restricted.
- Direct toxicity—High levels of certain ions, including sodium, chloride, and boron, can injure plant tissue directly.
- Altering nutrient availability—Certain nutrients as salts can change the availability and utilization of other plant nutrients (Landis 1981; Landis and Steinfeld 1990).
High salt levels are common in arid regions of the United States where there is inadequate precipitation to leach salts out of the plant root zone (Figure 3-48). As a result, salts move out of the topsoil and accumulate in the subsoil. At high enough concentrations, a layer of calcium carbonates form, creating an impermeable horizon call caliche. This layer restricts root growth and soil drainage. When topsoil is removed, the resulting surface soils may be very high in salts or where a caliche horizon is present, may expose a hardened calcium carbonate surface.
High salt concentrations can also be created by poor soil drainage resulting from compaction; when excessive amounts of fertilizer, manure, or compost are applied; or when de-icing chemicals applied to roads run off and enter the soil (Parent and Koenig 2003).
Deicing salts can pose a problem to plant establishment depending on the annual quantity of salt applied, distance from the road, type of salt applied, annual precipitation, and soil type (Section 3.11.9, see Deicing for Winter Safety). The sensitivity of a plant species is also important and it may be necessary to revegetate with plant species that are less sensitive to salts. These can be selected using the ERA tool.
How to Assess Salts—There are two methods of measuring salts: Electrical Conductivity (EC) and Total Dissolved Salts (TDS).
EC is a relatively easy test to run and is the most commonly used test in nurseries, forestry, and agriculture. Most pH meters are equipped to measure EC. Electrical conductivity measures how strongly electrical current flows between two metal plates. The more dissolved salts there are in solution, the greater the current and higher the electrical conductivity. EC is reported as the conductance over the distance between plates. The standard unit of measure is microSiemens per centimeter (mS/cm), though there are many ways that it can be expressed which can be confusing. To convert these units to mS/cm:
- mS/cm = 0.001 dS/m
- mS/cm = 0.001 mS/cm
- mS/cm = 0.1 mS/m
- mS/cm = 0.001 mmho/cm
- mS/cm = 1 mhos/cm
The most accurate method of assessing salinity is through lab analysis, however, quick estimates can be made with a hand-held pH/electrical conductivity meter using the Saturated Media Extract (SME) method for preparing samples as described in Section 3.8.4 (see pH). Landis and Dumroese (2006) provide a more detailed discussion on EC and measuring methods.
The second method of measuring salinity is the TDS. In this method, a known sample (water or soil solution) is evaporated and the remaining salt is weighed. This test is more difficult to run but it is often used in reporting salinity levels in road deicing studies. Test values are reported in milligrams per liter of water (mg/l) which is equivalent to parts per million (ppm). To convert TDS values to EC:
EC ( μS / cm ) = TDS ( mg / L ) / 0.6
Mitigating for Salts
Because high levels of soluble salts are often caused by poor soil management, the key to mitigating high salinity is to avoid creating the conditions that could cause those levels. In soils where internal drainage is poor, prevention may be the only feasible approach for reducing salt problems. Reducing the quantity of road deicing salts can also lower the amount of salts that enter the soil.
Avoid Mulch or Soil Amendments with High Salinity—Testing all materials to be applied to the site will aid in the prevention of increased salt levels in the soil. Amendment materials with electrical conductivity readings more than 1 S/cm should be avoided.
Reduce Commercial Fertilizers—Some commercial fertilizers, such as control-release fertilizers (CRF), can significantly increase the soluble salts found in the soil. This can be a major problem when using CRF in arid conditions. The fertilizer will begin to release following wet, warm spring conditions, but will not be leached through the soil without significant rainfall through the summer. Salts can build up to damaging levels, both on the surface and in the plant root zone.
Apply Gypsum with Irrigation—Incorporation of gypsum (calcium sulfate) followed by leaching can be effective in situations where sodium is the cause of high soluble salts (e.g., de-icing materials have been applied to roads). The calcium in gypsum will displace sodium, and the sodium will then leach out of the soil profile with irrigation or rainfall (UMES 2004).
Irrigation—Application of irrigation water if often used to leach salts from the soil. The amount of water depends on the soil type. In arid soils, application of 6 inches of water can reduce salinity levels by 50 percent; 12 inches can reduce salinity levels by 80 percent; and 24 inches can reduce salinity levels by 90 percent (UMES 2004). However, for most sites roadside project, this is not practical due to high costs.
Select salt resistant plant species—If salts are present or are expected to be present through deicing practices, selecting species from the ERA that are less sensitive to the effects of salts may improve revegetation.
3.8.5 SURFACE STABILITY
Surface stability is the tendency of the soil to remain in place under the erosive forces of rain, wind, and gravity. Good surface stability is essential for establishing plants, reducing erosion, and maintaining high water and air quality. When seeds are applied to unstable surfaces, they often move off the site through water or wind erosion leaving the site barren of vegetation. Soil is also removed in this process, which reduces the productivity of the site. Excessive erosion also affects the survival of planted seedlings by removing soil and exposing roots.
Site factors that influence surface stability and soil erosion are as follows:
- Rainfall
- Wind
- Freeze-thaw
- Soil cover
- Surface strength
- Infiltration rates
- Slope gradients
- Surface roughness
- Slope lengths
All surface erosional processes start first with the detachment of soil through the forces of rainfall, wind, or frost heave. These forces loosen seeds and soil, making them more susceptible to movement off the site. Surface runoff, during rainstorm events, is the primary factor in moving seeds and soil into stream channels, resulting in lost seeds and water quality problems. This occurs when infiltration rates (the rate water moves through the soil surface) are lower than rainfall rates. If slope gradients are steep, slope lengths are long, or surface roughness is low, surface water picks up energy and transports greater amounts of soil and seeds downslope. As this energy increases, water becomes concentrated with enough force to cut through the surface of the soil, creating rills and gullies. The degree to which soils detach is directly related to the percentage of soil cover protecting the soil (more cover, less erosion) and to the soil strength, or the capacity for individual soil particles to hold together under erosional forces. The result of soil erosion can often be detected on road cuts by noting how much sediment is in the ditch line. If the ditch is full of recently deposited sediment (recently deposited sediment usually lacks vegetation), there is a good chance that sediment came from the cut slope. An inspection of the surface of the cut slope will indicate if the sediment originated there. Gravels, cobbles, and even small plants will show the results of soil movement (see Figure 3-52, Figure 3-54, and Figure 3-55).
Rainfall
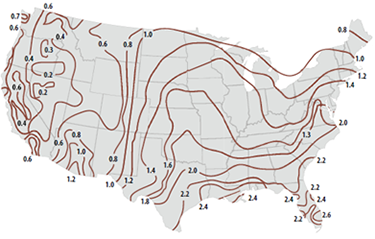 Figure 3-49 | Rainfall intensities across the US
 - Rainfall intensities increase moving from western to eastern United States. The differences in intensities can be dramatic, ranging from 0.2 inches/ hour in Nevada to 2.6 inches/hour in Florida for a 2-year, 1-hour storm event.
Source: FHWA
Each project site has a unique rainfall pattern that will affect the stability of the soil surface. Periods of high rainfall intensities can move seeds and soil particles off-site through erosional processes which begins with the raindrop. Raindrops have been likened to small bombs. In heavy rainstorms, they fall with such speed (up to 20 miles per hour) that, when they hit the soil surface, they create an impact that can blast the soil or seeds several feet away and leave behind small craters. After such events, the soils surface is compacted and sealed with fine soil particles that can significantly reduce surface infiltration rates.
The intensity of a rainfall event determines how much soil is detached. A high intensity rainfall will detach more soil particles than a low intensity rainfall. But detachment is only one aspect of erosion; it takes surface runoff to move soil and seeds downslope. If an intense rainstorm lasts only a short period, there may be insufficient water to exceed infiltration rates and water will absorb into the soil. If the duration is long, some water will not enter the soil, and run over the surface as overland flow, carrying soil and seeds downslope. The most critical weather events are those that bring high intensity rainstorms of long duration. High intensity rainfall is common in the central and eastern United States, whereas in the western U.S., high intensity storm events are less frequent and typically occur during summer thunderstorms or major winter storm systems (Figure 3-49). Precipitation in the form of snow is not typically a problem for surface erosion because snow cover protects the soil surface from rainfall splash and water from snowmelt usually occurs at such slow rates that even soils with low infiltration can absorb it, reducing the likelihood of runoff.
How to Assess Rainfall—It is unlikely that climate reports or weather records will give the duration and intensities of rainfall events for site level planning. Digital rainfall gauges are available that record the amount of rainfall and the time it occurred. This information is used to determine duration and intensity. While the cost of this equipment is high, it is becoming more affordable. Many types of digital rain gauges are available, ranging in price and quality. It is important to select a digital rain gauge that is rugged, self-maintaining, and can record for long periods of time. Some systems upload weather data to the internet where it can be accessed remotely through smart phones and computers for data summary and analysis.
Mitigating for High Rainfall
Minimize Disturbance—In areas of high rainfall or sites where water quality values are high (near streams or rivers), the best engineering design is to keep the footprint of the construction project disturbance to a minimum. Not only does this reduce the risk of delivering sediment to the aquatic system, it can reduce project costs by reducing the amount of area needing revegetation.
Integrate Erosion Practices—On disturbed sites, especially those near streams, the integration of erosion practices with plant establishment techniques offers the best approach to stabilizing the soil surface. These include practices such as increasing soil cover, shortening slopes, reducing slope gradients, leaving roughened surfaces, reducing compaction, increasing infiltration rates, and quickly establishing native vegetative cover.
Use Appropriate Mulching Practices—Applying a surface mulch is one of the best practices for controlling surface erosion because it protects the soil surface from rainfall impact and reduces overland flow. The types of mulches are described in Section 5.2.3.
Wind
 Figure 3-50 | Wind erosion removes topsoil and exposes roots
 - Wind erosion not only blows seeds, soil, and mulches off the soil surface, it will also expose roots of established plants, as shown in this photograph. Non-cohesive soils, like sands and silts, are most prone to wind erosion.
Photo credit: David Steinfeld
Wind erosion can be a major limiting factor in establishing native plants (Figure 3-50), especially in the Great Plains and portions of the Eastern Temperature Forests ecoregions (Figure 3-51). Wind erosion begins with a process called saltation in which a soil particle is lifted by the wind and bounced along the ground surface, dislodging other soil particles in its path. The resulting dislodged particles either become airborne or continue to roll or hop along the surface of the soil, dislodging more particles. Saltation occurs with very fine to medium sands, ranging from 0.003 to .04 inches (.07 to 1 mm). Particle sizes smaller than that (silts and clays) become airborne and can be carried long distances (Fifield 2004).
Wind erosion affects revegetation in several ways. Newly sown seeds and seed cover can be removed in high winds, resulting in poor germination and plant establishment. Plants that do establish, can be damaged through saltation, where dislodged soil particles continually abrade the plant stems. In extreme conditions, topsoil is removed, reducing the soil productivity and plant growth. This is more severe where topsoils are thin. Where plants are established, loss of topsoil can also expose roots, causing reduced growth and in some cases, mortality.
How to Assess Wind—Permanent wind speed equipment is available but is most likely beyond the reach of most project budgets. Site visits during different times of the year provide some indication if wind is a problem. Site characteristics, such as position on slope (ridgelines are more prone to high winds than a valley floor) or proximity to forested environments (forests often reduce wind speeds). Observing soil surfaces for signs of erosion can be helpful and include appearance of bare soils, exposed roots, and fine soils deposited behind stable structures. Local residents may also provide some information on local weather events.
Assessing risk of wind erosion can be determined by:
- Wind speed—The rate of soil movement is proportional to wind velocity. Wind speeds are considered erosive when they exceed 13 miles per hour measured 1 foot above the soil surface for loose sands (Lyles and Krauss 1971).
- Soil Texture—Silt contents have the most potential to be dislodged and become airborne. Clays can be susceptible when soils have been continually disturbed and clods have been destroyed. Sandy texture soils are less susceptible to becoming airborne but will move through surface creep and saltation.
- Rock fraction—The amount of rock fragments in a soil affects the severity of wind erosion; the more rock, the greater the protection of the soil surface. In addition, surface rocks may also collect windblown silts and sands over time, increasing soil depth.
- Organic matter—Soils that are higher in soil organic matter, especially organic cements that produce stable aggregates, have greater stability.
- Water content—water holds soil grains together through cohesion so when surface soils have a high moisture content, they have greater strength.
- Surface roughness—a roughened soil surface composed of a microtopography of ridges and valleys will trap and suspend soil particles, especially if the ridges are predominantly perpendicular to the direction of the wind.
- Vegetative cover—The height and density of vegetation affects the air flow on the surface of the soil; the greater the height and density the lower the wind velocity. Windbreaks, such as shelterbelts, can significantly reduce wind velocities (see Inset 3-3).
- Soil cover—Soils that are covered with a stable material are more resistant to wind erosion.
Mitigating for High Wind
Maintain vegetative cover—Keeping the construction footprint to a minimum is one of the best practices for controlling wind erosion. Minimizing the width of the disturbances perpendicular to the direction of the prevailing winds will also reduce the effects of strong winds.
Install shelterbelts—A shelterbelt is a line of trees that reduce the wind velocity and reduce the potential for wind erosion (Inset 3-3). The ERA tool can be consulted for appropriate trees and shrubs suitable for shelterbelts, depending on the ecoregion.
Create microtopography of ridges and furrows—When the soil surface is left in a roughened condition of ridges and furrows, wind erosion can be reduced significantly, however the effectiveness depends on the stability of the soil (Fryrear and Skidmore 1985). Ridges formed in non-cohesive soils or soils that do not form clods when tilled, will have a short life span.
Tillage, using a land imprinter (Section 5.2.2, see Roughen Soil Surfaces), may be a good alternative to loosening soils with traditional tillage equipment (e.g. disks, harrows) because imprinting compresses the soil while it forms depressions, thereby creating a roughened surface and increasing soil strength that will increase resistance to wind erosion (Dixon and Simanton 1977).
Mulch—Applying a mulch is one of the best practices for controlling surface erosion (Section 5.2.3), however, mulches be removed with strong winds. Some materials, such as wood strand mulches (Section 5.2.3, see Wood Strands and Wood Wool), have been tested under high wind conditions and, because of higher weights and interlocking particles, may be more resistant to high winds.
Lighter mulch materials, such as straw and hay, are more susceptible to wind erosion and have to be crimped into the soil to keep them in place. Hydromulch with tackifier or just tackifier applied with hydroseeding equipment can be effective in stabilizing hay mulches in areas with lower wind speeds.
Place Large Woody Material—Downed woody material, such as trees and large branches, can be used to block the soil surface from wind and rainfall.
Inset 3-3 | Wind breaks—shelterbelts and living snow fences
Shelterbelts. A shelterbelt is a vegetative barrier that reduces wind speeds, resulting in lower soil erosion. Shelterbelts also provide excellent pollinator and wildlife habitat. Shelterbelts work by creating wind resistance in the face of the prevailing wind. The reduction in wind velocity can be significant depending on the height of the shelterbelt. Depending on the wind speed, the effect on the leeward side of the shelterbelt (the side away from the wind), can be up 10 to times the height of the shelterbelt and on the windward side (the side toward the wind), as much as 5 times the height (see illustration below).
For greatest effectiveness, shelterbelts are designed perpendicular to the direction of the prevailing winds. Shelterbelts with multiple rows of vegetation have a greater reduction in wind speeds than single row shelterbelts because there is more vegetation to block wind flow. A two-row shelterbelt composed of shrubs and trees not only provides more wind resistance, it provides better wildlife and pollinator habitat. The effectiveness of a windbreak depends on the selection of tree and shrub species and planting density. It is important to understanding wind speeds, shelterbelt effectiveness, and appropriate species specific for the project area to develop an appropriate shelterbelt design.
Wind speeds can be reduced on the leeward side of a shelterbelt by 25 to 60 percent within a distance that is 10 times the height of the shelterbelt. It also can reduce wind speeds on the windward side by 25 to 80 percent within a distance 5 times the height on the windward side. In the example shown below, a 10-foot-high shelterbelt reduces the wind velocity significantly 50 feet before the shelterbelt and 100 feet beyond the shelterbelt (modified from Casement and Timmermans 2007).
Living Snow Fence. When vegetation is installed for snow management, it is referred to as living snow fences. Densely planted trees and shrubs along highways can reduce the amount of snow drift on roadways and subsequently, lower winter maintenance costs. These living snow fences create a barrier which reduces wind speeds and drops snow in front of and downwind of the break. It is necessary to understand the wind speed, wind direction, and annual snowfall when designing a living snow fence. Some of this information can be obtained from historic climate data from local weather stations (Section 3.3.1) but in most cases, it can be obtained from local maintenance personnel. Visiting existing snow fences during the winter can help in designing living snow fences. The most effective living snow fence is planted perpendicular to the prevailing wind direction at a minimum of 175 feet from the road centerline (South Dakota Department of Agriculture (2006). Other States and municipalities may have guidance on the design of natural or man-made snow fencing for their area. Shrub and tree species that grow at least 6 to 8 feet tall are good for living snow fences. Optimum snow storage capacity is achieved when individual rows have a density of 50 to 60 percent cover as viewed through the winter vegetation. Density is determined by how closely plants are spaced and whether the vegetation is deciduous or evergreen. When vegetation densities are low, more snow moves through the living snow fence while snow fences with high densities run the risk of being damaged by deep snow drifts (Brandle and Nickerson accessed 2017). The most effective living snow fences are those with at least two rows of shrubs or trees.
Freeze-Thaw
Freeze-thaw is the process of ice formation and ice melting that occurs in a 24-hour cycle within the surface of the soil. At night, temperatures drop at the soil surface and water begins to freeze within the soil pores, creating ice crystals. As ice crystals continue to form, water is drawn from the soil below through capillary action to replace the water that created the ice crystals. During freezing, ice crystals expand in the soil and push soil aggregates apart (Ferrick and Gatto 2004), weakening the internal structure of the soil. When soils thaw the following day, soil strength is greatly reduced (Gatto et al 2004), leaving the soil surface significantly less resistant to erosional forces. Freeze-thaw is considered one of the least understood aspects of soil erosion (Ferrick and Gatto 2004) and yet accounts for significant annual soil losses (Froese et al 1999).
The formation of ice crystals will destabilize the seed germination environment. Freeze-thaw cycles affect germinating seeds by creating ice crystals that physically push the new seedlings above the soil surface, exposing the emerging roots to extremely harsh conditions for seedling establishment, including low humidity, high temperatures, and sunlight. On steeper slopes, soil particles and germinating seeds move downslope after each freeze-thaw cycle, further destabilizing the seed germination environment. Freeze-thaw processes can also affect seedling establishment. Long periods of freeze-thaw cycles can push seedlings out of the ground, exposing roots and, in many cases, killing seedlings (Figure 3-52).
 Figure 3-53 | Freeze-thaw ice crystals
 - Ice crystals that form under freeze-thaw conditions can lift soil particles over 2 inches above the original surface. Later in the day the crystals will melt and the particles will drop.
Photo credit: David Steinfeld
Soils most susceptible to freeze-thaw effects are those with a high silt content or soils that are compacted. Soils are most susceptible when they are cold and wet. Silt-sized particles have pore sizes that are small enough to pull moisture to the layers that are freezing through capillary action, yet large enough to form ice crystals (Ballard 1981). Sandy soils do not draw moisture to the freezing layer because the pores are too big. Clays, on the other hand, have good capillary characteristics, yet do not have large enough pores for ice crystals to form (Ferrick and Gatto 2004). Sands are susceptible to freeze-thaw when they are compacted because the size of the pores is reduced, encouraging capillary rise (Gatto et al 2004). Soil cover, which includes litter, duff, and organic mulches, does not typically have good capillary rise characteristics, and therefore are less frost-susceptible. In addition, soil cover offers good thermal protection, which moderates the degree of freezing and thawing at the soil surface. The effects of freeze-thaw on surface stability increases as slope gradients steepen; the steeper the slopes, the greater the movement of seeds and soil downslope each day. For example, a seed or soil particle on a steep slope rises 2 inches on top of an ice crystal (Figure 3-53) but when the crystal melts, the seed or soil particle drops to a different point farther downslope. After many freeze-thaw cycles, the distance traveled by the seed or soil particle can be significant.
How to Assess Freeze-Thaw—Freeze-thaw processes typically occur in the spring and fall, when soil moisture levels are high and soil temperatures are cold. Soil surfaces that have undergone freeze-thaw cycles will have a very loose crust that will collapse when touched or walked upon. Gravels are often perched on pedestals, but give way under light pressure.
Project areas with bare surface soils high in silts or compacted sands should be considered prone to freeze-thaw processes, while soils with deep mulch or litter layers are less susceptible.
Mitigating for Freeze-Thaw
Apply Mulch—Available research on the mitigation of freeze-thaw effects is slim, but it can be assumed that practices, such as applying an organic mulch, will insulate the soil surface and minimize the effects of freeze-thaw. The deeper the mulch layer, the less propensity for freeze-thaw at the surface. Hydromulch applications at typical rates of 1,000 to 2,000 lb/ac are too thin to moderate surface temperatures or strong enough to resist the destabilizing effects of ice crystal formation on surface strength. Deep application of most mulches however, will bury seeds, resulting in poor seedling emergence. An alternative to is to apply needles or wood strands because these materials can be applied at greater depths and still allow light through for seedling emergence. For planted seedlings, the application of very deep mulches will reduce the effects of freeze-thaw. Gravels, cobbles, and stone can provide a stable soil cover. These materials are often left over after rock has been screen from the soil and designed into the slope can add surface stability and reduce evaporation.
Till Compacted Soils—Sandy soils are very susceptible to freeze-thaw if they are compacted. Loosening soils through tillage is perhaps the best method of mitigating the effects of freeze- thaw on these soil textures (Section 5.2.2).
Avoid Wet Soils—Consider avoiding planting or sowing in soils with high water tables and poorly draining soils. The extra moisture in these soils will continue to supply water for ice crystal formation. Planted seedlings can be pushed out of the soil in these environments (Figure 3-54).
Maintain Some Overstory Canopy—Trees and shrubs will moderate surrounding temperatures, reducing the potential for freeze-thaw.
Soil Cover
Soil cover is the layer directly above the surface of the soil. In an undisturbed environment, soil cover is composed of a combination of duff, litter, live plants, and rock. Soil cover is very important for surface stability because it dissipates energy from rain drop impact, protecting the soil from high intensity rainfall events. Furthermore, soil cover will slow the movement of runoff and capture sediments and seeds, preventing them from moving downslope. Section 3.8.3 discusses how soil cover is important for reducing evaporation; this section will discuss its role in stabilizing the soil surface and reducing erosion.
When the soil surface lacks cover, it is subject to the direct forces of raindrop impact, overland flow, wind, and gravity. These forces not only move soil offsite, affecting water and air quality, but they also displace seeds or remove soil from around newly developing seedlings (Figure 3-54). A lack of soil cover will impact revegetation objectives by reducing the quantity of seeds that will germinate. Seedlings that do emerge will be negatively affected by soil splash and sheet erosion that remove soil from around the seedling roots. The severity of soil erosion and seed movement is directly related to the percentage of bare soil.
After construction, most organic soil cover is removed. What remains is bare soil and coarse fragments (gravel, cobble, and stone). Left unprotected, bare soil will erode during rainstorms, leaving a pavement of coarse fragments (Figure 3-55). If the amount of coarse fragments in the soil is high, then the percentage of the soil surface covered by coarse fragments will also be high. By the third year, erosion rates on unprotected bare soils typically fall to a tenth of the rate of the first-year rate because of the formation of a coarse fragment surface (Megahan 1974; Ketcheson et al 1999). While this process produces less sedimentation to stream systems, the high coarse fragments at the soil surface are a poor environment for seed germination. For this reason, it is important to quickly stabilize the soil surface after soil exposure and why most road contracts call for temporary road stabilization during the construction period.
How to Assess Soil Cover—Soil cover can be measured by establishing transects and recording the percentage of rock, vegetation, litter, duff, and bare soil. A monitoring procedure for measuring soil cover is presented in Section 6.3.1.
Mitigating for Low Soil Cover
 Figure 3-56 | Many sites take more than one year to fully revegetate
 - Semi-arid, arid, and cold sites often take more than one year to fully revegetate. Photo A shows the vegetative establishment one year after hydroseeding on a semi-arid site; bare soil exceeds 60 percent. Photo B shows the same site almost two years after sowing; vegetation has fully established. Soil cover methods in these cases need to last several years for soil protection and plant establishment.
The primary objective of most revegetation projects is to stabilize the soil surface and create an optimum environment for seeds to germinate and plants to establish. To work, initial surface stabilization has to remain effective until plants become established and can protect the surface from erosion through vegetative cover. Therefore, the selection of surface stabilization methods can be based on: how effectively does the material stabilize the soil surface, does the material allow good seed germination and plant establishment, and how long does it remain effective (longevity).
Apply an Organic Mulch—A variety of mulches with varying qualities and longevities should be considered based on the erosional potential and revegetation needs of each site (Section 5.2.3). Short-fiber materials, such as wood fiber and paper products found in hydro- mulches, applied with a tackifier are a very effective short-term surface cover for protecting soil from rainfall impact. However, after a few months, these products are usually no longer effective. Higher rates of hydromulch and tackifier, which make up BFM products, have a higher degree of soil protection and greater longevity (up to a year). On many sites where the environment is optimum for establishing native plants, protection for less than a year is adequate. However, on sites that are cold, arid, or semi-arid, the establishment of vegetative cover can take longer than one year (Figure 3-56) and soil surface protection will likely require longer-lasting mulches such as straw, pine needles, hay, shredded wood, wood strands, or erosion fabrics.
Apply a Rock Mulch—Gravels, cobbles, and stone can provide a stable soil cover. These materials are often left over after rock has been screen from the soil and designed into the slope can add surface stability and reduce evaporation.
Surface Strength
When soil cover is removed, the surface of the soil is exposed to the erosive forces of raindrop impact, overland flow, freeze–thaw, and wind. How strongly soil particles bind together will determine the degree by which soil particles are detached and moved through soil erosion. Topsoils with good aggregation and high or- ganic matter will be more stable than subsoils or soils low in organic matter. Clay soils have greater strength than soils dominated by sands and silts which are non-cohesive. Seeds have no cohesive properties and, when sown on the surface of the soil without mulches or tackifiers, are very susceptible to erosive forces.
How to Assess Surface Strength—Determining the soil texture of the surface soil is a simple way to determine soil strength (Section 3.8.6, see Soil Strength). Soils low in clays (<15 percent) and high in sands will have low surface strength (Figure 3-57). In most cases, soils lacking topsoil will have reduced surface strength due to the lack of roots and organic matter that hold the soil particles together. The rainfall simulator is an indirect indicator of soil strength because it measures the amount of sediment that is detached from surface soils under various rainfall intensities (Section 3.8.5, see Rainfall). The USDA Natural Resources Conservation Service has developed a field test for determining surface stability for water erosion (Inset 3-4). This method rates how well surface soil samples maintain their stability after being agitated in water.
Inset 3-4 | Bottlecap test for surface stability
From Herrick et al 2005a
Place a soil fragment in a bottle cap filled with water. Watch it for 30 seconds. Gently swirl the water for 5 seconds. Assign one of three ratings:
M = Melts in first 30 seconds (without swirling)—Not stable
D = Disintegrates when swirled (but does not melt)—Moderately stable
S = Stable (even after swirling)—Stable
Mitigating for Low Surface Strength
Apply Tackifier and Hydromulch—Surface strength can be increased for up to a year by applying tackifiers by themselves, with hydromulches, or to bond straw onto the site (Section 5.4.2). These products strengthen the bonds between surface soil particles and between the soil particles and the products. Seeds applied with a tackifier are held tightly to the soil surface, reducing the likelihood that seeds will be detached and moved.
Apply Long-fiber Mulch—Applying a long-fiber mulch to the soil surface can increase the overall surface strength because of the direct contact of the material with the soil surface and the interlocking nature of the fibers (Section 5.2.3). The application of erosion mats can increase surface strength by an order of magnitude when in contact with the soil surface.
Infiltration Rates
 Figure 3-58 | Infiltration rates
 - When precipitation exceeds infiltration rates, water collects on the surface of the soil and begins to move downslope, causing erosion. On this site, litter and duff layers that typically protect the surface from rainfall impact have been removed, causing low infiltration rates.
Photo credit: David Steinfeld
Infiltration is the ability of the soil surface to absorb water from rainfall, snowmelt, irrigation, or road drainage. A high infiltration rate indicates that the soil surface can transmit high rates of water; a low rate indicates that the surface has low capability of absorbing water. When infiltration rates are lower than the rate of water input, runoff or overland flow will occur. Under these conditions, runoff can detach and transport soil particles, resulting in soil erosion and, in many cases, off-site water quality problems (Figure 3-58). Overland flow can also remove sown seeds.
The size, abundance, and stability of soil surface pores determine the infiltration rates of a soil. Large stable pores created by worms, insects, and channels created by decaying root systems will absorb water quickly and have high infiltration rates, while surfaces that have been compacted, have had their topsoil removed, or are low in organic matter will have poor infiltration rates.
Under undisturbed conditions, infiltration rates are usually high, especially where a litter and duff cover exists. When soil cover is removed, the impact from raindrops can seal the soil surface, creating a crust that will significantly reduce infiltration rates. Infiltration rates are also reduced when soil is compacted by heavy equipment traffic.
How to Assess Infiltration Rates—The most accurate equipment for measuring infiltration rates is the rainfall simulator. This equipment simulates rainstorms of different intensities under controlled conditions and measures how the soil surface responds. Infiltration rates are determined at the point when runoff occurs. The amount of runoff water is measured at the bottom of the plot to calculate runoff rates and sediment yields (Figure 3-59). While most rainfall simulators were developed for agricultural operations, several have been developed specifically for wildland conditions. These simulators were built for transportability and conservation of water because construction sites are often in remote locations and far from water sources. The “drop-forming” rainfall simulator, developed for wildland use, delivers rainfall at the drop size or impact velocity determined for the climate of the project site (Grismer and Hogan 2004).
Using the rainfall simulator in revegetation planning is expensive, yet it is an important tool and not to be discounted because of the cost. Specifically, rainfall simulation used to compare the effects of different mitigating measures, such as mulches or tillage, on runoff and sediment production takes the guess work out of whether such measures are effective. This quantitative evaluation of erosion control methods might be essential in areas where water quality objectives are critical.
In most cases, infiltration rates are estimated under routine field investigation by inference from site conditions. Infiltration rates can be considered high when the soil surface has not been disturbed and has a high percentage of cover. With compaction and loss of surface cover, infiltration rates are proportionally reduced. It is often assumed that construction activities that remove surface cover or disturb the topsoil will have very low infiltration rates that will create overland flow under most rainfall intensities.
Mitigating for Low Infiltration Rates
Avoid Compaction—Where possible, avoid operating heavy equipment on undisturbed soils or soils that have been tilled. Coordinate with project engineers to verify that site preparation does not compromise the compacted roadbed prism which is engineered as a structural entity.
Tillage—Infiltration rates can be increased through soil tillage (Section 5.2.2) which reduces compaction, increases macropore space, and creates surface roughness. Depending on the erosional characteristics of the site, the positive effects of tillage on infiltration rates might only remain effective through a series of rainfall events.
Incorporating Organic Matter—Incorporating organic matter into the soil surface can increase the longevity of infiltration rates created through tillage by forming stable macropores (Section 5.2.5). Unless macropores are interconnecting or continuous, however, they will not drain well (Claassen 2006). One method for creating continuous pores is to incorporate long, slender organic material, such as shredded wood or hay that overlaps and interconnects within the soil. Higher application rates of shredded wood or straw will result in greater porosity and infiltration rates.
Surface Mulch—Applying surface mulch will reduce the effects of rainfall impact on surface sealing and reduce soil erosion rates (Section 5.2.3). It does not, however, necessarily increase infiltration rates. Studies have shown that, while sediment yield can be less with the application of mulches, runoff rates are not necessarily reduced (Grismer and Hogan 2007).
Plant Cover—The best long-term way to increase infiltration is to create conditions for a healthy vegetative cover. Good vegetative cover will produce soils with extensive root channels, aggregated soil particles, and good litter layers.
Slope Gradient
Slope angle or gradient is important in surface stability because it directly affects how soil particles will respond to erosional forces; the steeper the slope, the greater the erosional forces will act on the surface of the soil. Slope gradient is a dominant factor in water erosion and dry ravel erosional processes. In water erosion, the rate of soil loss and runoff from disturbed soil surfaces increases incrementally as slope gradient steepens. In dry ravel erosion, the surface remains stable until a specific slope gradient is reached, and then soil particles move downslope under the direct effects of gravity. This critical angle is called the angle of repose and it can be likened to the angle that accumulated sands make in an hourglass. Only non-cohesive soils, composed of sands, silts, or gravels, have an angle of repose; soils with significant amounts of clays typically do not.
Figure 3-60 | Dry ravel - Steep, non-cohesive soils move downslope at a continuous rate. The soil surface is constantly moving and never stable long enough for seeds to germinate and plants to become established. These slopes can remain barren for years. Soils that are high in sands and gravels are the most susceptible to dry ravel. In this picture, trees became established below rock outcrops, where the surface was protected from dry ravel. Photo credits: David Steinfeld
Dry ravel is the downslope movement of individual particles by rolling, sliding, and bouncing (Rice 1982). It occurs more frequently as soils dry out and is triggered by vibrations from vehicles, animals, planes, and wind turbulence. Dry ravel creates a constant supply of material to the ditches at the bottom of the slopes making these slopes very difficult to revegetate unless the surface is stabilized. Seeds that germinate on steep, raveling slopes typically will not have enough time to put roots down deep enough to stabilize the surface before the emerging seedling moves or is buried by soil particles rolling down from above. Figure 3-60 shows dry ravel on a cut slope composed of a sandy soil
How to Assess Slope Gradient—Slope gradient is quantified in several ways, as shown in Figure 3-61. For road construction projects, slope is usually expressed as the rise (vertical distance) over run (horizontal distance). A 1:3 road cut, for example, defines a slope that rises 1 foot over every 3 feet of distance. Biologists, including range, forest, and soil scientists, use percent slope as a measure of slope angle. This is calculated by measuring the number of feet rise over a 100-foot length. Slope gradient as expressed in degrees is not commonly used.
Slope gradient can be measured in the field using a handheld instrument called a clinometer. This equipment reads slope angle in percent slope and in degrees. Readings from a clinometer can be converted to rise over run notation using the chart in Figure 3-61. Road construction plans display the slope gradients for every cross-section corresponding to road station numbers (refer to Section 2.4 and Figure 2-4). Using these cross-sections, slope gradients can be identified on the plan map by color coding the run:rise for cut and fill slopes. For instance, 1:1 cut and fill slopes might be highlighted red for areas of concern, while those areas with gradients 1:3 or less might be light green, favorable areas for mitigation work. This exercise can quickly identify areas with the highest risk for soil erosion and difficulty in establishing vegetation.
Slope angle plays a key role in revegetation planning because of its potential limitation on the types of mitigation measures that can be implemented. Figure 3-61 shows which practices are generally limited to gentle slopes and which can be implemented on steep slopes.
Mitigating for Steep Slope Gradients
Lengthen Cut or Fill Slopes—Slope gradient can be reduced by increasing the length of the disturbance. This will make the revegetation effort easier and more successful, but will increase the amount of area, or construction footprint, of the project.
Road planners consider many factors when they design the steepness of cuts and fills. A common strategy is to create cut and fill slope gradients as steep as possible. This practice disturbs far less land, resulting in less area to revegetate, and because there is less exposed soil, the potential for soil erosion is considerably reduced. Furthermore, there is a substantial cost savings with less excavation and revegetation work. Figure 3-62 shows an example of how increasing the steepness of a cut slope on a typical 1V:2H natural ground slope substantially decreases the length of disturbed soils.
The main drawback of steepening slopes from a designer’s standpoint, however, is that steeper slopes are much harder to revegetate and the selection of revegetation practices available are reduced as the steepness of the slope increases. Vegetation on steeper slopes are also harder to maintain using practices such as mowing. On sites with 1V:5H slopes or less, all revegetation practices are possible; on slopes approaching 1:1, the threshold of most revegetation practices has been reached, as well as the limit of what can be successfully revegetated. It is important to work with the design engineers early in the planning stages to consider the effects of slope gradient on meeting revegetation objectives.
Create Steep, Hardened Structures—Creating hardened structures or walls, such as retaining walls, crib walls, gabion walls, mechanically stabilized earth walls, or log terrace structures at the base of a steep slope, will allow gentler slope gradients to be constructed above the structure. With adequate planning, these structures can be revegetated.
Surface Roughness
Slopes that have roughened surfaces trap water during the initial stages of runoff (Darboux and Huang 2005). Roughened surfaces consist of microbasins that capture and store soil particles and seeds that detach in the erosional processes. Seeds that have been transported short distances into these depressions are often buried by sediments. Moderate seed covering from transported soil can enhance germination as long as the seeds are not buried too deeply. Microbasins can also be relatively stable during the period for seed germination and seedling establishment.
Surface roughness also reduces the effects of wind by reducing wind speed at the soil surface. Seeds may be blown into the depressions and become covered by transported soil. For both wind and water erosion, however, as the microbasins fill up with sediments, they become less effective in capturing sediments and seeds (Figure 3-63).

Figure 3-63 | Surface roughness creates favorable environment for germination - Surface roughness consists of microbasins that are favorable to seed germination and early plant establishment. Photo credit: David Steinfeld
How to Assess Surface Roughness—The simplest method for assessing surface roughness is to take several measurements of the distance between the top and bottom of the microbasin and average these values. Also count the number of microbasins in a 5-foot distance perpendicular to the slope direction. Shallow, closely spaced microbasins may create more area for seed germination but will also fill up faster with sediments, while microbasins that are deeper and farther apart will take longer to fill up and be more effective for erosion control but may have less surface area for optimum plant establishment from seeds.
Mitigation for Smooth Soil Surfaces
Leave Surface Roughened—Many project engineers have a tendency to “beautify” construction sites at the end of a road project by smoothing soil surfaces. While basic landscape shaping is essential, it is important to keep the soil surface as rough as possible. In many instances, leaving cut slopes “unfinished” or in the “clearing and grubbing” stage provides excellent seed bed diversity and growing environment. The diversity of micro-habitats provides greater climatic and soil environments for seed germination. An exception to this rule is where erosion control matting is used for slope stabilization. For the matting to function best, it needs complete contact with the soil surface. On roughened surfaces matting will “tent” over depressions. On smooth surfaces the correctly installed matting will contact the soil surface, hold seeds in place and stabilize the slope soils.
Surface Imprinting—Imprinting the soil surface to create micro-relief has been shown to be effective in reducing runoff and soil erosion and increasing plant establishment (Section 5.2.2, see Roughen Soil Surfaces).
Tillage—Tilling the surface soil layers will leave the site in a roughened condition (Section 5.2.2). This practice can have other beneficial effects on the soil, such as loosening compacted soils.
Slope Length
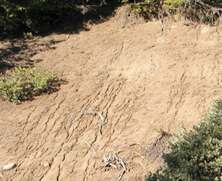
Figure 3-64 | Surface erosion increase with distance downslope - On this site, sheet erosion occurs at the top of the slope (A) and turns to rill erosion (B) as runoff collects. Mitigation that shortens slope lengths to less than the distance between A to B will reduce rill erosion. Photo credit: David Steinfeld
Another factor influencing soil erosion and seed transport is the length of slope. As the slope lengthens, so does the potential for transport of sediments and seeds. On very long slopes, the erosive force begins as sheet erosion at the top of the disturbance and often turns into rills and, in extreme cases, gullies at the bottom of the slope (Figure 3-64).
How to Assess Slope Length—Slope length can be measured in the field or from road plans. From road plans, slopes can be grouped into different lengths using the road cross sections (see Chapter 2). In the field, the effects of different slope lengths can be assessed by observing erosional features on existing disturbed areas. New or old disturbances can be used as references for critical slope lengths. Figure 3-64 demonstrates that at some point downslope rills begin to form. The distance that this occurs is the maximum length of slope for this slope angle and soil type before severe erosion takes place. This distance will vary by other factors addressed in this section (e.g., soil cover, climate, slope gradient, surface strength, surface roughness, and infiltration rates).
Mitigating Measures for Long Slopes
Install Barriers—Fiber rolls, straw wattles, downed wood, silt fences, or compost berms or compost socks can be laid on the surface as obstructions or barriers to reduce slope length. To be effective, they have to be placed in contact with the soil and perpendicular to the slope gradient, while straw wattles, hay bales, and silt fences have to be trenched into the soil.
Create Benches—The creation of slope breaks can reduce slope length. These breaks include benches, steps, or trenches cut into the slope. The reduced gradient at these breaks slows the velocity of overland flow and collects sediments (Figure 3-65).
If either practice is applied in along continuous line, they are constructed on contour to the slope. If they are not level, water can collect and move along the structure, much like a channel, and eventually spill onto the slope below, creating rills and gullies. (The exception to this is the construction of live pole drains to redirect water off-site for slope stability [Section 5.4.3, see Live Fascines]). When placed properly along the contour, slope distances are shortened and the structures collect sediments and create areas for plant growth. Plants that are grown above barriers or near the bottom edge of benches can take advantage of water and sediments that collect during rainstorms. Native vegetation can be incorporated into many of these designs to take advantage of increased soil moisture and sediment accumulation. A good practice is to place these structures apart from one another less than the critical distance where rills are expected.
3.8.6 SLOPE STABILITY
This discussion is directed to non-engineers to simplify and make accessible basic slope stability concepts to be understood in developing revegetation strategies. It is by no means a substitute for professional engineering expertise. Technical references for slope stability are many (including Carson and Kirby 1972; Spangler and Handy 1973; Brunsden and Prior 1984; Denning et al 1994), to which the reader is referred for a comprehensive review of this subject. For a detailed evaluation of the role of vegetation in slope stability, the reader is referred to Gray and Leiser (1982).
Creating stable slopes is essential for establishing healthy plant communities, but the reverse is equally true—establishing native vegetation is critical for stabilizing slopes. The following Cohesive soils discussion takes the latter perspective of how to create the most favorable environment for establishing vegetation on potentially unstable slopes and how this approach can be integrated into the overall strategy of slope stabilization. A vegetated slope adds stability to slopes by holding the soil together through a network of root systems and by removing water from the soil, which is the primary driving force behind most landslides.
Slope stability is the resistance of natural or artificial slopes to fail through gravitational forces. The landforms resulting from slope failures are called landslides and they are described by their morphology, movement rates, patterns, and scale. This section will focus on two general types of landslides that are common to road cuts and fills—slumps and debris slides (Figure 3-66). Slumps typically occur on deep soils that are cohesive (e.g., rich in clays). They tend to be deep seated and slow moving. Viewed in profile, the failure occurs in a circular motion, resulting in a series of tilted blocks and circular cracks. Debris slides are shallow, fast-moving landslides that form on non-cohesive soils (e.g., sandy, gravelly). These landslides occur on steep slopes.
Water is the driving force behind most slope stability problems encountered in road projects. It comes as rainstorms, snowmelt, and often as diverted surface water from road drainage. As water increases in a potentially unstable slope, the added weight of the water in the soil plus the increased pressure of water in the pores (pore water pressure) eventually exceeds the strength of the soil and the slope fails (Figure 3-67).
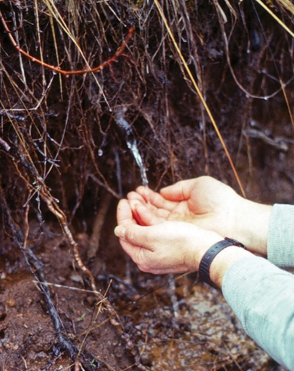
Figure 3-67 | Water pressure and slope stability - Water pressure is greatest when soils are saturated. Slopes release this pressure through channels created by decomposing roots, animal burrows, and worm holes. When pressures become greater than the strength of the soil, slopes fail. This picture of a decomposed root releasing water pressure was taken 30 minutes before the road cut failed. Photo credit: David Steinfeld
Increased water to a slope is especially a problem where a restrictive layer (e.g., a layer of soil that limits water movement) is close to the soil surface. As water moves through the surface horizon and encounters a restrictive layer, it builds up in the pores of the horizon above it, increasing water pressure. The saturated horizon becomes heavier and eventually the slope fails under the added weight of water and increased pore water pressure.
The faster water moves through soil, the less susceptible a slope is to failure. The measured rate at which water is transmitted through a soil mass is its permeability. When permeability is high, water quickly moves out of the soil pores, reducing the potential for increased pore water pressure and slope weight. When permeability is low, water slowly moves through soil and builds up in the soil pores. On gentle slopes, this is typically not a problem, but as slope gradients increase, gravitational forces acting on the slope raise the potential for slope failure. Slope length is another factor important to water movement because the longer the slope,the greater the buildup of water near the base of the slope. This phenomenon explains why many slope failures occur in the mid to lower portions of fill slopes.
Whether a slope fails or not is ultimately due to the strength of the soil. Soil strength is affected by the amount of clay present in the soil, the level of compaction (the greater soil compaction, the more stable the soil), and the presence of roots (more roots are better). Compaction of soils to increase soil strength usually takes priority in road design over creating optimum soil conditions for root growth. With this practice, not only are there fewer root systems to add slope stability, there is also reduced vegetative cover, which is important for intercepting and removing water from the soil. A road design that integrates vegetation into the stability of the slope can meet both road and revegetation objectives, but it will take a collaborative approach.
This section will discuss each of the following parameters as they relate to increasing slope stability through revegetation treatments:
- Permeability
- Restrictive layers
- Water input
- Slope length
- Slope gradient
- Soil strength
Permeability
The rate at which a volume of water moves through soil material is its permeability (technically referred to as hydraulic conductivity). Soils that have moderate to high permeability rates tend to be more stable than those with low permeability rates. Where permeability is low, water fills the soil pores but does not drain quickly, adding additional weight to the slope and increasing the pore pressure. Both factors reduce the overall strength of slopes and increase the likelihood that slope movement will occur when other conditions are right.
Soils with large interconnecting pores have a higher permeability than soils with smaller pores that are less interconnecting. Soil textures that are well-graded (soils that have only one particle size) typically have a higher permeability than poorly graded soils (soils having a range of particle sizes from clays to small gravels). For example, poorly graded granitic soils have low permeability rates because the different-sized particles are neatly packed together, restricting the pathways for water flow. Well-graded soils, such as pure sands and gravels, have high permeability because pores are large and interconnecting. Alternatively, compacted soils often have low permeability rates because of the reduced or destroyed interconnecting macropores.
How to Assess Permeability—Simple field tests, such as percolation tests, historically utilized in assessing septic leach fields, can be used for determining permeability rates. A small hole is excavated and water is poured to a specified depth. The time to drain the water from the pit is measured in inches per hour.
These tests are run at different soil depths to determine if permeability rates change. Results from percolation tests are subject to significant variability. Nevertheless, they can indicate the relative permeability of different soil types or different soil disturbances.
Engineering laboratory tests for determining permeability include the constant head permeameter for coarse-grained soils. In this test, a soil sample is placed in a cylinder at the same density as the soils in the field. Water is introduced and allowed to saturate the sample. A constant water elevation, or head, is maintained as the water flows through the soil. The volume of water passing through the sample is collected and this provides a direct measurement of the flow rate per unit of time. The test can be repeated at various densities to determine the corresponding permeability. The test can also be repeated for various additions of organic amendments and compaction levels to determine the effects of these treatments on permeability. Consider consulting a soil lab for how to collect and submit samples for these tests.
Where testing is not feasible, engineering and soil texts can give ranges for expected permeability based upon the soil gradation and classification. A field assessment can also give some indication of permeability rates. Subsoils or soils lacking organic matter that have a range of soil particle sizes, from clays through small gravels, have a propensity for low permeability rates, especially when they are compacted (Section 3.8.2, see Soil Structure).
Mitigating for Low Permeability
Tillage—Loosening compacted soil through tillage practices (Section 5.2.2) increases permeability by creating large fractures or pathways for water to flow. However, tilled soils often return to near-original permeability as the soils settle over time.
Organic Amendments—Long-fibered organic matter, such as shredded wood, tilled deeply into the soil will increase the infiltration and permeability of the soil because larger, interconnecting pore spaces are created (Section 5.2.5). Several studies evaluating the incorporation of unscreened yard waste suggests that an optimum rate of organic matter additions for increasing infiltration and improving soil structure is approximately 25 percent compost to soil volume (Claassen 2006). In addition, incorporating organic matter can increase slope stability because amended soils are lighter in weight than non-amended soils (mineral soils can weigh 10 to 20 times more than soils amended with 25 percent organic matter). The reduced soil weight lowers the driving forces that create unstable slopes.
Restrictive Layer
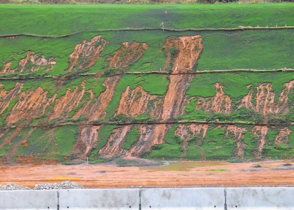
Figure 3-68 | Restrictive layers can decrease slope stability - In this photograph, a restrictive layer is very close to the soil surface. During a rain storm, water moved through the shallow soil layer and encountered a restrictive layer. Water then moved downslope, through the soil, building up pressure, until the increased pore pressure and soil weight exceeded the strength of the soil. At this point, the mid to lower slopes failed. Photo credit: David Steinfeld
A restrictive layer is any soil horizon or stratum (including unfractured bedrock) that has very low permeability. As water flows through a surface horizon with good permeability and encounters a restrictive layer, the rate of downward water movement slows and water builds up in the pores above. The boundary between the permeable surface layer and the harder subsurface material is often a zone of weakness, sometimes referred to as a slip plane. Slope failure occurs when the pores in the soils above the restrictive layer become saturated with water to a point where the pore water pressure and soil weight exceed the soil strength. The depth of slope failure depends on the thickness of the soils above the restrictive layer. On slopes where the restrictive layer is near the surface, slope failure, if it occurs, will be shallow (Figure 3-68). Where the contact is deeper, the soil movement will be more extensive. The types of landslides that occur with restrictive layers are debris slides.
How to Assess Restrictive Layers—Restrictive layers in natural settings can be inferred by the presence of seeps and springs. These features occur most often at the point where a restrictive layer is intercepted or exposed to the surface. These can be intermittent features that are observed in the winter or spring but are dry in the fall or summer. The vegetation around permanent and temporary seeps and springs is typically composed of water-loving species, such as sedges (Carex spp.) and rushes (Juncus spp.). Figure 3-69 shows how a seep is created when a cut slope intersects a restrictive layer.
On construction sites, restrictive layers can be created by placing a loose soil or compost over highly compacted subsoil. These layers can be identified in the field by determining soil strength using a soil penetrometer or shovel to find compacted or dense soils (Section 3.8.6, see Soil Strength). On roadbed fill slopes or road cut slopes the compaction of the soils can be assumed. This layer is then assessed for the approximate amounts of silt and clay using the field texturing method. Dense or compacted soil layers that are high in silts and clays are likely to be very restrictive to water movement.
Figure 3-69 | Restrictive layers and ground water - Groundwater moves downslope above restrictive soil layers. Seeps are seen in road cuts where the restrictive layer is exposed. Increased soil water that occurs above restrictive layers can decrease slope stability.
Field permeability tests can be used to determine the rates of water flow (Section 3.8.6, see Permeability). Often restrictive layers are not observed until after construction when they manifest as intermittent seeps or wet areas in cut and fill slopes. Geotechnical investigation will determine if these features are due to shallow water movement associated with restrictive layers or interception of deeper subsurface water.
Mitigating for Restrictive Layers
Tillage—If restrictive layers are within several feet of the soil surface, site treatments that break up portions of this layer can increase permeability, which will increase stability. Site treatments that accomplish this are bucket tillage, deep ripping, spading, and fill cut (benching and backfilling), which are discussed in Section 5.2.2. The drawback to tillage is that it will reduce soil strength in the short term until roots occupy the soil and increase soil strength. Temporary irrigation systems have been installed on sites where quick establishment of grass cover during summer and fall is essential for slope stabilization prior to winter precipitation (Hogan 2007). Tillage techniques that leave a deep uneven subsurface profile reduce the potential for downslope debris slides.
Organic Amendments—Where possible, the incorporation of organic matter will help keep the restrictive layer from returning to its original soil density and allow more time for roots to establish (Section 5.2.5). As described above, soil strength is reduced until vegetation becomes established, but the negative effects of reduced soil strength are offset by the increased permeability and reduced soil weight of the organic amendments.
Key-In Surface Material Installations—Installation of straw wattles, staked in place on contour, prior to installation of topsoil or compost can hold permeable surface layers in place long enough for plant root systems to knit the layers together. Consider using fully biodegradable wattles.
Figure 3-70 | Live pole drains - Slumps are characterized by scarps, cracks, and benches. Water collects on benches and in cracks where it is transmitted into the slide mass, creating continued instability. Slopes can be stabilized by removing water through a series of hand-dug surface ditches. Using the cracks as guides for the location of ditches, they are filled in with soil and dug wide enough for a willow fascine (Section 5.4.3, see Live Fascines) to be placed in the bottom (A). Called “live pole drains” (Polster 1997), these structures not only quickly move surface water from the slide to more stable areas, but the willow cuttings in the fascines, encouraged by the presence of high soil moisture, grow into dense vegetation (B) that stabilize the slide through the deep rooting and dewatering. Photo credit: David Steinfeld
Live Pole Drains—Live pole drains are constructed to intercept water from seepage areas and remove it through a system of interconnecting willow bundles to more stable areas, such as draws, ditches, or other waterways (Figure 3-70). The interception and flow of water encourages the establishment and growth of willow cuttings along the length of the live pole drain.
Water Input
Water, which is the driving force behind most landslides, comes through rainfall, groundwater flow, snow melt, or diverted from other areas through road drainage. Landslides often occur after a series of strong winter storms have delivered a high amount of rainfall over a short period of time. Under these conditions, soils have not had sufficient time to drain before the next storms arrive and water in the soil builds up to a very high pressure (Figure 3-67). With additional storms the combination of increased pore water pressure and additional weight of water in the slopes eventually leads to slope failure. Landslides can occur where water from road ditches or other road features drain water onto marginally unstable slopes. Major site factors that affect water input are rainfall duration and intensity, rain-on-snow events, and road drainage.
How to Assess Water Input—See Section 3.8.1 for how to assess water input.
Mitigating for High Water Input
Proper Surface Drainage—Increased water is the driving force behind slumps and debris slides. Designing proper water drainage is probably the most important measure to implement for slope stability (Gedney and Weber 1978). Where road water is inadvertently routed into potentially unstable areas, there is a greater potential for slope failure (Fredricksen and Harr 1981). Road projects that are designed to move storm water away from or out of unstable slopes as quickly as possible through road and slope drainage structures increase slope stability. In some cases, installing a curb at the top of the cut slope will effectively move water away from unstable slopes below. Coordinate with engineers to ensure that surface runoff, during construction of phased projects, is addressed prior to completion of final storm water system.
Species Selection—Select species that have adapted to wet soils. These include sedges (Carex spp.), rushes (Juncus spp.), bulrushes (Scirpus spp.), willows (Salix spp.), cottonwoods (Populus spp.), and cedars (Thuja spp. and Chamaecyparis spp.). Because each species has a unique way, or strategy, of modifying the moisture regime of a site, planting a mixture of species is a way of ensuring that all strategies are represented on the site. For instance, willows establish quickly and can draw large quantities of moisture from the soil, but only when the willows have leaves. Cedars, on the other hand, are slower to establish, but longer lived. They can withdraw moisture from the soil during the winter, unlike deciduous species. When they are well established, they intercept large amounts of water in the crowns, preventing precipitation from reaching the soil. Trees have a great ability to significantly deplete moisture at considerable depths (Gray and Leiser 1982). Wetland species, such as rushes and sedges, unlike many tree and shrub species, grow well in saturated soils.
Live Pole Drains—The live pole drain (Polster 1997) is a biotechnical engineering technique where continuous willow bundles (Figure 3-70) are placed across a slope, much like an open drain, to redirect water to a more stable area, such as channels and draws. Where small slump failures have occurred during or after construction, live pole drains can be installed to increase slope drainage, add root strength, and remove soil moisture from the slide mass.
Slope Length
Slope length is important for stability because the longer the slope, the more water concentrates in the lower portion of the slope. Increased water increases pore water pressure and soil weights, thereby decreasing the stability of the mid to lower sections of long slopes. This is one reason why slumps are often observed in the mid to lower slope positions of longer fill slopes.
How to Assess Slope Length—Slope length can be obtained from road plans or measured directly in the field using a tape.
Mitigation for Long Slopes
Live Pole Drains—Using live pole drains (discussed in the previous section), shortens the distance water is transmitted through the hill slope by intercepting surface and subsurface water in ditches at frequent slope intervals. Captured water is transmitted downslope through a system of continuous fascines to a stable channel (Figure 3-70).
Create Benches—Another method of reducing slope length can be the creation of a slope break, such as benches, steps, or trenches cut into the slope. The reduced gradient at these breaks slows the velocity of overland flow and collects sediments. However, unless the water is directed off the slope, total water input to the slope is not reduced.
Slope Gradient
As slope gradient increases, the destabilizing gravitational forces acting on the slope become greater. On a level surface, the gravitational force stabilizes the soil mass but as gradients increase, the strength of the soil mass to resist sliding along the failure plane decreases.
How to Assess Slope Gradient—Assessing slope gradient is discussed in Section 3.8.5 (see Slope Gradient).
Mitigating for Steep Slopes
Mitigating measures for steep slopes are discussed in Section 3.8.5 (see Slope Gradient).
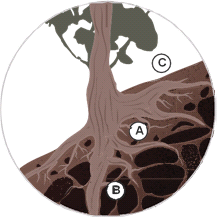
Figure 3-71 | Plant roots and slobe stability - Plant roots and stems increase slope stability by (A) reinforcing the surface horizon through a matrix of roots, (B) anchoring surface horizons to rock or subsoils, and (C) stems supporting the soil upslope.
Soil Strength
Soil strength (technically referred to as shear strength) is the characteristic of soil particles to resist downslope forces. Physical and biological factors play roles in soil strength. The major physical factors contributing to increased soil strength are reduced porosity (compacted soils), greater range of particle sizes (poorly graded soils), greater angularity of the soil particles, greater surface roughness, and the presence of silts and clays that add cohesive strength (Hall et al 1994).
The biological components of increased soil strength are the matrix of roots that reinforce the surface horizon, roots that anchor an unstable soil mantle to stable subsoils or rock, and stems (e.g., trunks of trees) that add support to the soil immediately uphill (Hall et al 1994) (Figure 3-71). The physical factors, unfortunately, do not always support the biological factors. For example, high porosity soils are of particular interest to the designer because of the role porosity plays in root growth. From an engineering standpoint, however, high porosity soils have lower soil strength because soil particles are not packed closely together and are less interlocking. Balancing the needs of creating a healthy soil for optimum vegetation while still maintaining slope stability until established vegetation adds root strength to the soil is a challenge to engineers and revegetation specialists. A road design that creates soils with high porosity will also decrease soil strength in the short term; however, if this practice increases the biological productivity of the site, the long-term result is a net increase in soil strength (Gray and Leiser 1982). The growth habits of native species can greatly influence slope stability because each species has a unique rooting pattern and root tensile strength. For instance, grass roots are very fibrous and abundant in the surface horizon, adding surface stability when the grass cover is high. Grass and forb roots, however, add very little soil strength at deeper depths because their roots are not as strong and do not penetrate as deeply as tree roots (Gray and Leiser 1982).
Alternatively, roots of shrub and tree species are long and deep rooted, with relatively high tensile strength (Gray and Leiser 1982). The main advantage of tree and shrub species is the long vertical roots (taproots) that can cross failure planes and bind the soil strata together (Figure 3-71).
How to Assess Soil Strength—The designer will probably not perform engineering tests for soil strength, yet knowing a little about these tests could be important, especially if the designer is making recommendations that soils on potentially unstable sites be deeply tilled or amended with organic matter.
A common method engineers use to estimate soil strength is to correlate soil classification (from sieve analysis and the characteristics of clay particles) with published literature values. Shear vanes or cone penetrometers are good methods to approximate the strength of fine-grained soils in the field, and published research is used to correlate these readings with laboratory shear strength test results.
The triaxial shear test is a more precise laboratory method to determine shear strength of soils. In this test, a long cylinder of the soil is placed in a latex membrane and submerged in a clear plastic cylinder filled with water. A vertical pressure is applied to the cylinder at a slow rate until the soil sample shears. Very sensitive strain gauges measure the soil displacement, applied forces, and any pore water pressures that develop. Various water pressures are applied to the cylinder to simulate the confining pressure of soil depth (Brunsden and Prior 1984). This test can be used to determine the shear strength of soils that have been amended with organic materials.
Mitigating for Low Soil Strength
Biotechnical Engineering Techniques—Many biotechnical slope stabilization techniques use vegetative cuttings from willows or other easy-to-root species to structurally reinforce the soil. As these materials root, they add further stabilization to slopes through interconnecting root systems and soil moisture withdrawal. These practices include stake planting, pole planting, joint planting, brush layers, and branch packing (Section 5.4.3).
Shrub and Tree Seedlings—On drier sites, where willow cuttings are less likely to survive and grow, shrub and tree seedlings can be used. While these species are slower growing, they usually have deeper root systems and persist longer once they are established. Grass and forb species can quickly establish on drier sites, but soil strength is limited to the surface of the soil profile where the roots are most abundant. For this reason, grasses and forbs do not provide as much stability (Figure 3-72). On potentially unstable sites, grasses grown between shrub and tree seedlings add soil strength to the surface soil while tree and shrub species become established. On dry sites, however, grasses are excluded around seedlings or vegetative cuttings until the latter have become established. Because of the steep, shallow nature of many of these sites, planting seedlings is not always practical or successful. It is worthwhile to consider hydroseeding or hand sowing, covered by a surface mulch that will protect the surface from erosion for several years while the shrubs become established, should be considered.
Soil Improvement—Improving soil productivity will increase root densities and enhance slope stability (Hall et al 1994). Mitigating measures that improve water storage, organic matter, and nutrients should, with time, increase slope stability. Some practices, such as soil tillage, reduce soil strength in the short-term. However, once plants have become established more roots occupy the soil and slope stability is increased. Consider integrating tillage with practices that quickly reestablish vegetation to ensure that slope stability is not compromised in the short term. On slopes where root strength is critical for stability in the first year after construction, irrigation could be considered to quickly establish a dense vegetation cover.
Temporary Soil Stabilization—It is important to implement erosion control practices that stabilize the surface of steep slopes while vegetation develops a strong root system and top growth. Where trees are inappropriate because of clear zones and shrubs inappropriate because of sight lines, erosion control products work well to stabilize soils while grasses and forbs establish.
Back to top
3.9 IDENTIFY FACTORS THAT AFFECT POLLINATORS
For projects where one of the objectives is to improve pollinator habitat, it is important to identify the core habitat elements supporting local pollinator populations. Similar to identifying limiting factors to plant establishment, as discussed in Section 3.8, the designer evaluates a project area for how well it supports a diversity of pollinators prior to construction and identify those factors important for improving pollinator habitat on roadsides after project construction.
The Pollinator Habitat Assessment Checklist (Chapter 7) is a guide to assessing current and potential habitat conditions based on information collected during the field information planning phase (Section 3.3 and Section 3.6). While the checklist provides habitat characteristics important for most pollinator habitats, the designer may want to modify the checklist to also include the climate, soils, vegetation, and pollinator species of interest specific to the project area and project objectives.
Once the designer has assessed the current condition of the pollinator habitat and identified parameters that are limiting to pollinator populations, a list of mitigating measures can be developed. Mitigating measures are site treatments that will improve pollinator habitat. For example, if breeding habitat is limiting, a mitigating measure is to include butterfly host plants.
There are usually several ways to mitigate each limiting factor and designers can select the measures that most suit their site conditions and objectives discussed in the following section.
3.9.1 NECTAR AND POLLEN SOURCES
Pollinators such as beetles, flies, wasps, moths, butterflies, bees, hummingbirds, and bats all forage for food on flowers. Nectar and pollen are sources of carbohydrates and protein, respectively, for pollinators. The act of pollination is an incidental effect of feeding or gathering food: animals visit flowers seeking sustenance, and in the process transfer pollen grains which allow flowering plants to reproduce.
Flowering plants in roadsides are important sources of nectar and pollen for pollinators that reside within the roadside habitat (e.g., Munguira and Thomas 1992) as well as those that use the roadside as a partial habitat for foraging but reproduce or overwinter elsewhere (e.g., Ouin et al 2004). Adults of bees, butterflies, wasps, hummingbirds, and many species of flies, moths, beetles, and bats feed on nectar to maintain their energy levels. Some adult beetles and flies require the protein that pollen provides in order to reproduce. Female bees actively collect pollen to take back to their nests (Figure 3-73), where they provide for their offspring by leaving a supply of pollen moistened with nectar. The availability of pollen and nectar influences the abundance and diversity of pollinators found on roadsides (Saarinen et al 2005; Hopwood 2008).
Attractiveness and Overlapping Bloom Times
It is important to include plants that are known to provide floral resources and attract pollinators. Native plants are more attractive to native pollinators than exotic plants, even when both plant types are present in sites (Hopwood 2008; Williams et al 2011; Morandin and Kremen 2013a). Some species of native plants are particularly attractive to a wide range of pollinators, offering either large quantities of nectar, high quality nectar, or pollen with high protein content. Sourcing plant material locally or within the ecoregion is best for pollinators because the phenology (flowering period) can also differ with the provenance of the plant material (Norcini et al 2001; Houseal and Smith 2000; Gustafson et al 2005) (Section 3.3.3 and Section 3.13.2). Bloom times of non-locally sourced plants have the potential to be out of sync with pollinators. This may be particularly problematic for bee species that are pollen specialists (e.g. Melissodes desponsa, a pollen specialist on thistles, Figure 3-73) and are reliant on the pollen from a small subset of plants and time their emergence from overwintering with the bloom time of their host plants.
Additionally, it is important to have flowers available to pollinators throughout the growing season. While pulses of bloom can provide critical resources to pollinators, sustained resources create functional habitat throughout the growing season to best support robust populations and communities. For example, solitary bees have distinct flight seasons that last 4 to 6 weeks. Bees that emerge early in the growing season can begin to forage in February in warmer parts of the U.S., with late-season bees foraging through October. Social bee species have overlapping generations and require forage throughout the growing season.
Gaps in bloom early in the spring or late in the fall are can be easily overlooked during the planning stages, but these are times when nectar and pollen are very important to the health of pollinators such as bumble bees, honey bees, and migrating monarch butterflies. Early-season pollen and nectar sources are important for those species that have flight seasons in the spring and will lead to greater reproduction of those species. Early season forage is also important for pollinators like bumble bees and honey bees that fly all season long but that are in need of floral resources early in the spring after overwintering. Late season flowers provide resources that ensure that queen bumble bees have ample food going into winter hibernation, and that honey bee colonies have enough food stores to last through the winter.
The availability of pollinator-friendly plant species and overlapping bloom times at a site prior to construction can be assessed by recording the plant species that are flowering and their percent cover every 2 to 4 weeks starting at the beginning of the growing season through the fall (February through October in California). These vegetation surveys would be conducted on both the project site and undisturbed reference sites (Section 3.6.1).
It is best to have a minimum of 3 to 5 species of trees, shrubs, or wildflowers blooming during each season (spring, summer, fall). Ideally there would be 5 to 10 species blooming per season, overlapping to ensure availability of resources to the entire pollinator community. Increasing the diversity of flowering plants in seed mixes and planting plans can help to prevent gaps in bloom. If flowering species have been recorded at reference sites during the growing season, these species can be used to develop a list of species with overlapping blooms for the revegetation project. When field surveys have not been conducted, a species list using the ERA tool can be used to generate lists of the recommended workhorse and pollinator-friendly plant species for all EPA Level III ecoregions in the continental United States. The ERA will also denote the bloom periods of the plant species and which general groups of pollinators the plant species will benefit.
Floral Diversity and Cover
Whenever possible, it is best to increase the diversity of wildflowers and blooming shrubs or trees. Pollinator diversity increases with increasing flowering plant diversity (Potts et al 2003). Different pollinators have different floral needs and preferences, so including a diversityof plant species with different flower shapes, sizes, colors, and growth habits helps support the greatest abundance and number of species of pollinators (Ghazoul 2006; Ponisio et al 2015). Additionally, greater flowering species provide greater diversity of pollen and nectar sources for honey bees. Diversity in diet can help support honey bee immune system health (Alaux et al 2010; Di Pasquale et al 2013).
Floral cover is also important; having sparse resources will not sustain pollinator populations whereas high densities of blooms are more attractive and can support higher numbers of pollinators (Herrera 1998). For example, it is best for pollinator habitat to maximize the percentage of wildflowers included in revegetation projects involving herbaceous plants (Figure 3-74). The combination of grasses and wildflowers can effectively resist weed colonization and provide soil stabilization. A planting seed mix that consists of grass species at 50 percent or less of the seed mix volume can prevent the grasses from outcompeting the wildflowers. It is ideal to aim for 45 percent cover of flowering plant vegetation across a growing season. For example, flowering plant cover could be spread out throughout the growing season, with 15 percent cover of vegetation in spring, 15 percent in summer, and 15 percent in autumn.
It can be helpful to emulate the species diversity found on reference sites located in nearby natural plant communities. Diverse plantings that resemble natural communities are the most self-sustaining and long-lasting plantings because they better resist weed invasions and pest outbreaks. A general walk through of the area may be enough to identify flowering species or a more intensive sampling can be conducted using monitoring procedures described in Chapter 6. The Species Presence monitoring procedure (Section 6.3.3) can be used to record floral diversity and the Species Cover monitoring procedure (Section 6.3.2) can be used to record floral cover.
When working at sites with low diversity and floral cover, clumping single species together can benefit pollinators (Frankie et al 2002). For example, planting small clusters of single species of flowering plants to form patches of color when in bloom helps pollinators to spot the plants quickly. This is especially helpful for pollinators searching landscapes for limited resources and also helps pollinators to move quickly and efficiently between flowers to collect the resources they need. In larger plantings, clusters are less important as long as flowering plants are abundant.
Floral cover and diversity increases with site productivity. By improving soil characteristics, floral cover and diversity will increase. On projects where resources are limited, areas important for pollinator habitat can be identified and soil improvement conducted specifically in those areas.
3.9.2 BREEDING HABITAT
Pollinators have diverse habitat needs for breeding, in particular for their egg-laying sites. The habitat needs for insect pollinators are especially varied because insect pollinators select locations in which to lay their eggs based on the needs of their larvae. The main groups of insect pollinators, bees, beetles, flies, moths, butterflies, and wasps, all have four distinct life stages: egg, larva, pupa, and adult. Eating and growing are the primary functions of the larval stage, followed by the dormant pupal stage during which body tissues rearrange and transform into the adult stage. The primary goal of the adult stage is reproduction. The needs of pollinator larvae are often different than the needs of adults.
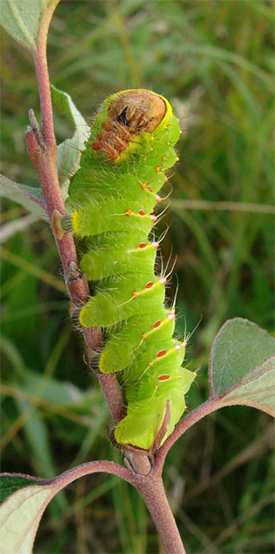
Figure 3-75 | Caterpillars, butterflies, and moth larvae devour plant material - This giant silkworm moth (Antheraea polyphemus) will feed on a number of host plant species, including maples (Acer) and plums (Prunus). Photo credit: MJ Hatfield
For example, the eggs of some beetles and flies are laid near prey on vegetation or in the leaf litter so that their larvae, which are predatory, have access to the food resources they need. Butterfly and moth larvae (also known as caterpillars) consume vegetation and are found on the leaves and stems of plants, and their eggs are laid on certain species of host plants preferred by their larvae. Bees and predatory wasps construct nests in which to lay their eggs (Section 3.9.3). Roadsides can serve as breeding habitat for all of these and more.
Host Plants
Egg-laying sites for butterflies and moths consist of plants upon which the adult will lay eggs and the larvae will feed after hatching (Figure 3-75). Some butterflies and moths may rely on plants of a single species or genus for host plants. For example, caterpillars of the monarch butterfly feed only on species of milkweed (Asclepias spp.) and closely related genera. Some species are even more specialized; caterpillars of the Karner Blue butterfly (Lycaeides melissa samuelis) will only survive on lupine (Lupinus perennis). Other species may exploit a wide range of plants. The larvae of some swallowtails (Papilio spp.) can feed on a range of trees, shrubs, and wildflowers. Given this lifecycle pattern, establishing caterpillar host plants is recognized as a way to sustain butterfly and moth populations (Croxton et al 2005; Feber et al 1996). Roadsides with host plants can support habitat generalist butterflies as well as habitat specialists and migrant species such as the monarch butterfly (e.g., Ries et al 2001; Kasten et al 2016).
There are two main considerations for assessing whether butterflies and moths are using the site for breeding: (1) if host plant species are present within the site and (2) if present, if eggs and/or caterpillars of butterflies and moths are also present at the site. If the goals of the project include supporting particular species of butterflies or moths, it is useful to monitor the presence of the host plants of the target pollinator species. Section 6.4.3 includes a monitoring procedure for host plant abundance and population estimates of a target species (e.g. monarch butterfly) based on counts of eggs and caterpillars.
Many plants used in revegetation projects serve as butterfly and moth host plants, but it may be necessary to include additional species to support particular butterflies or moths. For example, planting milkweeds will contribute to the recovery of the monarch butterfly (Inset 3-5). The ERA tool includes information about the host plant needs of target butterfly and moth species. For additional information, see the HOSTS database of the world’s Lepidopteran host plants created by the Natural History Museum, London. The database can be searched by either plant species or Lepidopteran species.
Egg-Laying Sites
The breeding habitat needs are less understood for groups of pollinators beyond butterflies and bees, though what is known suggests that egg-laying sites for beetles, flies, and other pollinators are usually close to food sources for their larvae. If larvae are carnivorous, as is the case for lady beetles, eggs are laid on vegetation near their aphid prey, while syrphid or flower fly species that consume detritus or other decomposing materials as larvae lay their eggs in leaf litter. Egg-laying sites can include moist soil, leaf litter or plant debris, on foliage near prey, or in crevices under bark or rocks (Table 3-11).
Inset 3-6 | Milkweeds and adjacent landowner concerns
Increasing milkweed populations in North America is critical to the recovery of the monarch butterfly, but one obstacle to widespread inclusion of milkweeds in new plantings is the perception that milkweeds are in fact weeds. Concerns include:
- the potential for milkweeds to expand from the original planting site and encroach on adjacent land, and
- the chemical compounds present in milkweeds and their toxicity to livestock.
Although milkweed, the common name for plants in the genus Asclepias, implies that the plants are indeed weeds, milkweeds are a diverse group of native wildflowers with nearly 100 species in the U.S. that are not listed as noxious weeds at either the State or the federal level in the U.S. Milkweeds may be perceived as weeds because a few species will colonize disturbed areas and tend to reproduce vegetatively (in addition to reproduction by seed), sending up new shoots from roots that spread outward from the parent plant. This clonal reproduction allows their populations to expand over time, and plants may spread out of their original area. Common milkweed (Asclepias syriaca) exhibits the highest degree of clonal reproduction, and vegetative growth also occurs to a lesser degree in horsetail milkweed (A. subverticillata), narrowleaf milkweed (A. fascicularis), plains milkweed (A. pumila), prairie milkweed (A. sullivantii), showy milkweed (A. speciosa), and whorled milkweed (A. verticillata) (Borders and Lee-Mader 2014). Despite their vegetative growth, many of these species are unlikely to create an ongoing and unmanageable weed problem for roadside managers or adjacent landowners. However, the issue can also be avoided by selecting from the many milkweed species that do not reproduce clonally.
Another contributing factor to the perception of milkweeds as actual weeds is the presence of cardenolides, steroid plant compounds milkweeds use as a defense against herbivores. The amount of cardenolides present in plant tissue varies with the species of milkweed (it can also fluctuate seasonally) and can make the plants potentially toxic to livestock (Burrows and Tyrl 2013). Farmers and ranchers with livestock are often concerned about the presence and proximity of milkweeds to their stock. However, in properly managed rangeland and pasture, milkweed should pose no risk to livestock. Milkweeds are toxic only if consumed in large quantities, and milkweeds are highly unpalatable (Fulton 1972). Livestock, cattle in particular, will only consume milkweeds in the absence of other forage; milkweed can only poison a cow when it is in a pasture that is barren. Milkweed poisoning can be prevented by maintaining a sustainable stocking rate and by verifying that sources of hay are milkweed-free (milkweed retains its toxicity when dry and may increase in palatability).
Soil cover can potentially serve as a proxy for egg-laying sites for some pollinators. A monitoring procedure for measuring soil cover is presented in Section 6.3.1. Visual scans of vegetation can be used to identify colonies of aphids, whiteflies, or other clusters of plant feeders that serve as egg-laying sites for pollinator species with predatory larval stages (e.g. flower flies).
3.9.3 NESTING HABITAT
Bees and predatory wasps provide for their young by constructing and provisioning nests in which their offspring develop. Bees provision their nests with pollen and nectar as food sources for their young, while predatory wasps supply their young with prey to consume. Some species of bees and predatory wasps nest underground, while others nest in tunnels and in cavities. Nesting is a critical factor affecting the ability of bees to persist within a site (Winfree 2010; Menz et al 2011; Morandin and Kremen 2013b).
Table 3-11 | Egg-laying sites for pollinators
|
Pollinator Group
|
Egg-laying sites
|
| Beetles |
In crevices, in the soil, on leaves, under plant debris or in leaf litter, on foliage near prey |
| Bees |
In nests (See Section 3.9.3) |
| Butterflies and moths |
Host plants |
| Flies |
On foliage among prey, on larvae (for parasitic species), in leaf litter |
| Wasps |
In nests (See Section 3.9.3) |
| Bats |
Breeding habitat unknown but bear live young in roosts such as caves, bridges, etc. |
| Hummingbirds |
Eggs in nests, often in forks of branches of trees and shrubs |
Soil as Pollinator Nesting Habitat
Most of North America’s native bee species (about 70 percent) nest in the soil. Ground nesting bees provide for their young by excavating nests in the soil. Their offspring develop underground in cells (also known as brood chambers). Ground nesting bees need access to soil surfaces between vegetation to excavate and access their nests (Michener 2007). Some species will nest in a variety of soils while others have very specific requirements for the soil type, moisture, alkalinity, slope, and aspect (Cane 1991).
Many ground-nesting bees prefer to nest in sunny, bare patches of soil (Linsley 1958; Sardiñas and Kremen 2014). Such patches can be found under wildflower plantings where small areas of bare ground are exposed between plants (Figure 3-76A) or around the bases of native bunch grasses that tend to grow in dense bundles. Providing openings in scrub or forest habitat can promote ground-nesting bees (Figure 3-76B). Bunch grasses tend to provide better nesting habitat than sod-forming grass species, and roadsides with native bunch grasses have more nesting opportunities for ground-nesting bees and, consequently, a greater abundance of ground-nesting bees (Hopwood 2008). Bunch grasses also allow establishment of other desirable species and prevents colonization from rhizomatous species. Undisturbed areas of bare ground can facilitate nesting activity (Potts et al 2005; Winfree et al 2009; Williams et al 2010; Roulston and Goodell 2011).
Assessment of patches of bare ground or patchy plant cover can be made through measurements of soil cover. A monitoring procedure for measuring soil cover is presented in Section 6.3.1. Ideally, patches of non-erodible bare ground would be present and cover approximately 5 percent of the project site. If using thick mulch during establishment, it can benefit ground nesting bees and wasps if there are small patches of bare soil left without mulch. Another idea for creating a permanent area of bare soil is to have short sections of cut slopes or banks that are very steep and constantly raveling, preventing plants from establishing. These sections would need to be away from water so that soil would not erode into the stream system.
Stems and Tunnels
A number of above-ground nesting bees nest in hollow stems or excavate pithy stems (e.g., elderberry or cane fruits) (Figure 3-77A). Many of these plants provide resources to other wildlife, such as berries (e.g., Salmonberry). Other native bees nest in tunnels in wood, such as abandoned beetle tunnels in logs, stumps, and snags (Michener 2007) (Figure 3-77B). Where site appropriate, planting native wildflowers with pithy stems, such as cupplant (Silphium perfoliatum), ironweeds (Vernonia spp.) and sunflowers (Helianthus spp.), along with shrubs such as wild rose (Rosa spp.), elderberry (Sambucus spp.), sumac (Rhus spp.), yucca (Yuccaspp.) or agave (Agave spp.), will provide resources for stem-nesting bees.
Assessment of potential tunnel nest sites can involve identifying woody plants (species and numbers) that support tunnel-nesting bees that can be planted at the project site. Additionally, because many tunnel nesting species create their nests in tunnels originally built by other insects (e.g., beetles), in old wood, such as snags, or living tree trunks, it can be useful to quantify the amount of dead wood, snags, or wood with holes in it (e.g., fence posts) that already exist at the site or that can be established within the project site.
The best method for increasing nesting habitat for tunnel nesting bees (and predatory wasps with similar nesting habits) is to plant woody vegetation used by bees and to maintain snags or downed wood. A minimum of three species of woody plants or pithy stemmed plants is recommended, though a good rule-of-thumb is to include at least five species. The ERA tool provides information about plants that provide nesting resources for bees. Maintaining or importing dead wood, snags, or wood with holes in it (e.g., fence posts) within the project site will also benefit tunnel nesting bees.
Cavities
Most native bees are solitary and nest either in the ground or in wood or pithy stems. Bumble bees, however, are social and have different nesting requirements. Bumble bees form social annual colonies founded by a single queen in the spring. A bumble bee colony can grow in size through the spring and summer as the bees work cooperatively to raise offspring and find food. At the end of summer, if the colony is healthy, new queens are produced. Queens find mates in the fall, their natal colonies die off, and queens find a place to overwinter, such as in leaf litter or under a shallow layer of soil. Bumble bee colonies need an insulated cavity in which to nest, such as underneath grass clumps (Svennson et al 2000), under the thatch of bunch grasses (Figure 3-78), or under rocks (Hatfield et al 2012). Bunch grasses have a tendency to “lodge” at maturity, meaning they create a gap between the grass and the soil surface that can provide an ideal nesting cavity for bumble bee colonies (Svennson et al 2000; Hatfield et al 2012). Mowing and grazing can have negative impacts on bumble bee colonies (Hatfield et al 2012). If a colony is destroyed via mowing mid-growing season, no queens will be produced, which can lower population levels the following year.
The nest entrances to bumble bee nests can sometimes be located in wood piles. In addition, wild bees may use holes in wood in woodpiles for nest entrances. Wood piles are also attractive to other wildlife, including birds. If non-native woody vegetation is being removed from a project site, leaving some of the wood piled at the edges of the habitat into one or more brush piles can provide nesting locations and also support populations of ground beetles.
Assessment of nesting habitat for bumble bees involves counting the number of different native bunch grass species present, calculating the relative area of the site bunch grasses cover, and noting if downed wood is present at the site.
If native bunch grasses are adapted to the site, it is best to have at least one native perennial bunch grass species present, covering at least 2 percent of site. Ideally there would be at least 2 different species in each project site. If woody vegetation is removed from the site, leave at least 1 wood or brush pile. It is also important to maintain areas of unmown bunch grasses throughout the growing season to support bumble bee nests.
3.9.4 WATER SOURCES
Pollinators utilize water in multiple ways. Some directly consume water, while others use it to construct nests or for evaporative cooling. Pollinators can obtain water from edges of water sources, drops on vegetation, wet soil, puddles, or small pools on rocks.
Water, Mud, Minerals
Although pollinators typically obtain much of the water content they need by consuming nectar, water is also consumed directly on occasion or is collected by pollinators for hydration or evaporative cooling. On warm days it isn’t unusual to see bumble bees gathered around the edges of puddles or perched on rocks in streams to sip water. Honey bees will collect water and transport it back to their hive in the heat of the summer to spread the water lightly over their brood and fan them with their wings to reduce the temperatures within the hive via evaporative cooling. Honey bees will also use water to dilute stores of crystalized honey within their hive. Water can also be used by ground nesting bees or wasps that carry it to the soil to moisten hard dry ground to make it easier to dig their nest tunnels.
A number of wild native bees and wasps utilize mud in their nest construction (Figure 3-79). Blue orchard bees (Osmia lignaria) collect mud and use it to create nest chambers for their offspring. Blue orchard bees so rely on mud that the females will not nest in areas without a source. Potter wasps (Hymenoptera: subfamily Eumeninae) also use mud as nest partitions within an existing cavity, as well as free-standing mud structures. Mud-puddling is a behavior to gather liquid nutrients exhibited by butterflies and some other pollinators in which they congregate on wet soil to gather minerals and nutrients needed for their health.
Water sources for pollinators can include culvert outlets, ditches, draws, gullies, and intermittent streams. Water runoff from the edge of the pavement can also create a source of mud for pollinators.
It may not be practical to include a potential water source in every revegetation plan. It also may not be a conservation priority for pollinators. As mobile animals, pollinators can fly to obtain the water or mud they need from surrounding land. However, projects that incorporate topographic enhancements into the roadside design will increase the potential for temporary surface water and mud sources (Section 5.2.8).
3.9.5 SHELTER AND OVERWINTERING
Like other animals, pollinators rely on various places that provide shelter during inclement weather. High winds, rain, cool temperatures, cloudy days, and other weather conditions all force pollinators to seek shelter. Pollinators are a diverse group of animals with a diverse set of needs for shelter and overwintering habitat (Table 3-12). Some rely on vegetation, such as the structure provided by grasses or the cover trees and shrubs provide. Others use rocks or crevices as shelter.
Pollinators also need a place in which to overwinter during the dormant season. Overwintering sites for most species are close at hand. Syrphid fly species and soldier beetles overwinter in roadside soil or litter (Schaffers et al 2012), and butterflies and moths also utilize roadsides as overwintering habitat (Schaffers et al 2012). However, a few species travel long distances to overwinter in warmer locations. Examples of migratory pollinators include monarch butterflies, painted lady butterflies, lesser long-nosed bats, and hummingbirds.
Table 3-12 | Shelter and overwintering sites for pollinators
|
Pollinator Group
|
Egg-laying sites
|
| Beetles |
Larvae overwinter in loose soil or leaf litter Adults shelter under rocks, logs, brush |
| Bees |
Adults take shelter in bad weather under leaves on plants; overwintering of most species occurs. In nests (Section 3.9.3), but queen bumble bees overwinter under shrubs or in shallow soil and leaf litter. |
| Butterflies and moths |
Shelter in structure of vegetation; Overwinter in a protected site such as a tree, bush, tall grass, or a pile of leaves, sticks, or rocks |
| Flies |
Pupae and adults overwinter in soil or leaf litter |
| Wasps |
In nests (See Section 3.9.3) |
| Nectar-feeding bats |
Caves, mines, rock crevices, tree bark, under bridges and within bridge structures |
| Hummingbirds |
Shelter in trees and shrubs; some are resident and some overwinter in southwest U.S., southern Mexico, and Central America |
Woody Vegetation and Grasses
Woody vegetation such as trees and shrubs can provide cover during the growing season that can serve as shelter for pollinators, and can also provide niches for overwintering. Some pollinators will overwinter under bark or in the soil just under shallow roots, or in piles of brush. Grasses can provide shelter for a variety of pollinators but notably for butterflies on roadsides (Saarinen et al 2005), and the root systems and grass thatch can also serve as overwintering habitat.
Assessment of shelter and overwintering habitat can involve identifying woody plants and grasses (species and numbers) that can be planted at the project site. It may be useful to calculate the relative area of the site that grasses cover. Refer to the monitoring procedures for soil cover (Section 6.3.1) and species cover (Section 6.3.2) for additional information.
Including a diversity of types of plants in revegetation plans can help to ensure that vegetation structure that can act as shelter and overwintering habitat is present. Trees and shrubs may not be appropriate for every revegetation project; in those situations, including a diversity of grasses both cool and warm season grasses can increase vegetation structure.
3.9.6 LANDSCAPE CONNECTIVITY
With habitat becoming increasingly fragmented (Saunders et al 1991), landscape connectivity is important for the populations of many species, including pollinators (Haddad 1999; Haddad and Baum 1999). Roadsides have the potential to act as corridors, strips of habitat or patches of habitat that serve as stepping stones that connect larger patches of habitat, facilitate movement of organisms between habitat fragments, aid in establishing or maintaining populations, and increase species diversity within isolated areas (Tewksbury et al 2002; Ottewell et al 2009).
Roadsides extend across a variety of landscapes and often contain greater plant diversity than adjacent lands. The linear shape and connectivity of roadsides may help pollinators move through the landscape (Soderstrom and Hedblom 2007), either for daily foraging or for dispersal between larger habitat patches.
Evidence suggests that pollinators use roadsides as corridors to facilitate movement through the landscape in search of food or in pursuit of new habitat (Lövei et al 1998; Ries et al 2001; Valtonen and Saarinen 2005; Hopwood et al 2010). Additionally, there is evidence of several pollinator species expanding their ranges along roadsides (Dirig and Cryan 1991; Brunzel et al 2004). Corridors like roadsides and other linear strips of vegetation may provide habitat resilience as changes in climate drive species range contractions or expansions.
It is important to consider the landscape con- text of the revegetation project. Developing a landscape connectivity map of the project area and adjacent lands, using information collected during the vegetation assessment (Section 3.6.1), that locates areas of high, medium, and low pollinator habitat qualities, can be a base for designing a revegetation plan that improves pollinator habitat within a larger landscape connectivity context (Figure 3-80). If resources are limited, it can be helpful to prioritize high floral diversity and cover and other factors that influence pollinators for projects that link or act as stepping stones between existing habitats on private, municipal, state, or federal lands. It is also important to prioritize those projects that can increase the connectivity of existing roadside habitat. If remnant roadside habitat exists, for example, it would be very beneficial if revegetation projects with high plant diversity were installed adjacent to or nearby.
3.9.7 ROAD MORTALITY
Roads can pose specific threats to pollinators. Roads can be a source of mortality for pollinators due to collisions with vehicles (e.g., Munguira and Thomas 1992). Roads may act as barriers to pollinator movement (e.g., Valtonen and Saarinen 2005). The prevalence of invasive and nonnative species on roadsides reduces pollinator abundance and diversity (e.g., Hopwood 2008). Finally, roadside vegetation is exposed to pollution from vehicles, which may impact pollinators (e.g., Jablonski et al 1995).
Vehicle Mortality
Collisions with vehicles are a source of mortality for pollinators that utilize resources in roadsides as well as pollinators travelling through the landscape. Mortality rates can be estimated by counting roadkill (McKenna et al 2001; Baxter-Gilbert et al 2016) but provide incomplete information. Estimates of the population sizes of pollinators using roadsides, in addition to counts of those killed by vehicles, provides a mortality rate that includes context for the proportion of the population impacted. Mortality rates of butterflies using roadside vegetation range from 0.6 percent to 7 percent of the population (Munguira and Thomas1992) or 6.8 percent of the butterflies found on the roadside (Skorka et al 2013). Of the butterflies observed crossing roads, 2.8 percent were hit by vehicles (Ries et al 2001).
Rates of mortality due to collisions with vehicles are influenced by a number of factors. Some species of pollinators are more vulnerable to collisions than others due to their behavior or biology; species that are strong fliers, for example, appear to have lower rates of mortality than those that are not (Munguira and Thomas 1992; Ries et al 2001; Skorka et al 2013). Volume of traffic may influence rates of mortality (Skorka et al 2013); however, several studies have found that traffic volume does not consistently influence observed mortality (McKenna et al 2001; Saarinen et al 2005). The width of road or overall density of roads in the landscape may also influence butterfly response to roads. Wider roads may increase mortality rates (Skorka et al 2013) and some butterflies have decreased movement within a dense network of roads (Valtonen and Saarinen 2005).
Vegetation quality can also influence pollinator mortality: roadsides with more species of plants had fewer butterflies killed by traffic (Skórka et al 2013) (Figure 3-81). The frequency of mowing is also linked to a higher proportion of butterflies killed on roads; butterflies that had to disperse to find new habitat after roadsides were mowed may have had a greater likelihood of collisions with vehicles (Skórka et al 2013).
If quality roadside habitat is present, it may reduce the amount of pollinators killed by vehicles by providing pollinators with necessary habitat and less need to disperse elsewhere. It is important to consider increasing plant diversity of the roadside vegetation and reducing mowing beyond the clear zone (the strip of low growing or routinely mowed vegetation, or vegetation-free area, directly adjacent to the pavement) in order to reduce mortality rates due to vehicles. In areas with high traffic density, it may be helpful to increase the width of the clear zone, which is not typically used by pollinators as habitat, to increase the distance between pollinators foraging in the habitat and vehicles on the roadway. When developing the landscape connectivity map, it may also be helpful to prioritize locations for high quality revegetation projects with goals of supporting pollinators, focusing first on sites that are not in areas of high road density.
Invasive Species
Many invasive and noxious plants can be present in roadsides (Tyser and Worley 1992; Gelbard and Belnap 2003) due to favorable conditions for plant introductions and invasions (Hansen and Clevenger 2005; Von der Lippe and Kowarik 2007). Nonnative plants can decrease the quality of roadside habitat for pollinators (Hopwood 2008; Valtonen et al 2006). Nonnative plants compete with native plants for resources as well as alter habitat composition, and some cause significant reductions in the abundance and diversity of pollinators and other herbivorous insects (Samways et al 1996; Kearns et al 1998; Spira 2001; Memmott and Wasser 2002; Zuefle et al 2008; Burghardt et al 2009; Tallamy and Shropshire 2009; Wu et al 2009; Hanula and Horn 2011; Fiedler et al 2012). There is also evidence that native pollinator insects prefer native plants (Burghardt et al 2009; Wu et al 2009; Williams et al 2011; Morandin and Kremen 2013a), even though many native insects will feed on nonnative plants when few natives are available (Zuefle et al 2008; Burghardt et al 2009; Wu et al 2009; Williams et al 2011).
To reduce invasive species and nonnative plants, it can be helpful to control weeds before and during construction (Section 3.11.5), as well as during the establishment phase following revegetation (Section 3.11.6) and maintaining a weed-resistant roadside following construction (Section 3.11.4). Salvage topsoil whenever possible, and source the imported project mulch, compost, and other inputs carefully, specifying testing certificates and/or certified weed free products where possible, in order to avoid introducing and spreading weed seeds. Additionally, purchasing seeds for the revegetation project within seed transfer zones can help to curb the spread of weed seed contamination of seed mixes.
Roadside Contamination
Routine vehicle use and maintenance of roads contribute to roadside contamination by depositing pollutants, including vehicle exhaust and de-icing materials. Roadside soils and vegetation can be contaminated with heavy metals such as lead, iron, zinc, copper, cadmium, nickel, et al deposited from tire rubber, brake dust and gasoline and diesel combustion products (Gjessing et al 1984; Oberts 1986; Araratyan and Zakharyan 1988). Vehicle-de- rived contamination is proportional to traffic levels (Leharne et al 1992). In general, plant and soil contamination is greatest adjacent to the road and decreases with distance from the road (Quarles et al 1974; Dale and Freedman 1982; Jablonski et al 1995; Swaileh et al 2004). Contamination tends to decline within 20 meters but can still be present at high levels up to 200 meters from the road (Spellerberg 1998; Trombulak and Frissell 2000). Pollen and nectar contamination is also greatest nearest to the road (Jablonski et al 1995).
Heavy metals can be harmful to pollinators directly (Nieminen et. al 2001; Moroń et al 2010; Perugini et al 2011) or indirectly by weakening vegetation (Mulder et al 2005). However, few studies have explicitly examined the impacts to pollinators of heavy metal exposure in roadsides. Ozone, nitrates, and other exhaust gases may also have an impact on roadside vegetation and pollinators. Ozone and nitrates can inhibit floral scent, which reduces a pollinator’s ability to detect flowers and in turn may reduce reproductive output of both pollinators and plants (McFrederick et al 2008). Dry deposition of particles with nitrogen derived from fuel combustion can create a strip of “fertilized” soil along roadsides, particularly in more arid regions (Gade 2013).
De-icing salts used on roads alter roadside soil chemistry by increasing sodium levels in plant tissues significantly (Snell-Rood et al 2014) and can damage plants (Bogemans et al 1989), with probable indirect impacts on pollinators (Section 3.11.9, see Deicing for Winter Safety). Varying levels of sodium in butterfly host plants can affect development of caterpillars in both positive and negative ways. Sodium is an important micronutrient for butterflies and moderate levels of sodium can increase flight muscle and brain size of adults (Snell-Rood and other 2014). More data about the impacts of salts, heavy metals, and exhaust on pollinators is needed. Until that data is available, increasing the width of the clear zone, particularly in areas with high traffic and frequent use of road salts, may help reduce pollinator exposure to these contaminants.
3.9.8 VEGETATION MANAGEMENT
Figure 3-82 | Mowing pattern can facilitate pollinator habitat - Cutting the clear zone with well-defined edge looks groomed and provides safe run-off zone. Photo credit: Magnus Bernhardt/ODOT
The management of roadside vegetation can have a significant impact on pollinators. Mowing vegetation beyond the clear zone multiple times a growing season, for example, can cause direct mortality to pollinators in the egg or larval stages that cannot avoid the mower (Humbert et al 2010) (Figure 3-82), can deprive pollinators of sources of pollen and nectar, as well as host plants for caterpillars (Johst et al 2006) (Figure 3-83), and can destroy bumble bee colonies (Hatfield et al 2012). However, the timing and frequency of mowing can be adjusted to reduce the impacts to pollinators (e.g. Halbritter et al 2015). When designing revegetation plans, it is important to consult with the site’s maintenance department. Maintenance departments have processes and practices in place for reasons that are not obvious to habitat designers, such as the timing of mowing. Discussions with maintenance departments may result in a willingness to alter maintenance practices that can facilitate pollinator habitat, but that determination cannot be made without the designer opening communication with roadside maintenance.
If maintenance practices cannot be adjusted in ways that support pollinators, there are other opportunities for pollinator habitat on land managed by DOTs that are not roadside rights of way. These areas include DOT “back 40” lots, stockpile lots, maintenance yards, under used DOT office land, special management areas, bicycle paths, scenic viewpoints or historic or geologic points of interest or roadside rest areas. Maintenance is often glad to put forthright uses to these underutilized areas. These areas also offer opportunities for collaboration with citizen groups because they are less exposed to the hazards of traffic and DOTs may be more willing to allow volunteer groups to install or manage pollinator gardens in these areas.
If one of the goals of the project is to support pollinators, it is important that the vegetation can be managed such that pollinators benefit. For additional information about vegetation management and strategies that can support pollinators, see Chapter 7.
Back to top
3.10 INVENTORY OF SITE RESOURCES
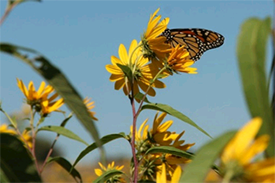 Figure 3-83 | Mowing can affect food sources
 - If mowing occurs too frequently, plants will not be able to flower and pollinators will have fewer sources of food.
Photo credit: Jennifer Hopwood/Xerces Society
Most project sites contain resources that can be used to meet revegetation objectives. Identifying these potential resources early in the planning process is essential so that they are not inadvertently wasted. The more that local resources are used, the more cost-effective, efficient, and effective the revegetation efforts may be. Physical resources to inventory include topsoil, duff, litter, parent materials, woody materials, logs, plant materials (seeds, seedlings, and cuttings), large rocks, and water (seeps, springs, creeks). It is good practice to also consider intangibles, such as community cooperation and the local knowledge base.
3.10.1 TOPSOIL
One of the most important site resources for revegetation is topsoil. If considered early in the planning process, topsoil can be salvaged and reapplied to disturbed sites after construction. This is one of the best ways of increasing productivity on a disturbed site.
Topsoil is inventoried early in the planning process to evaluate topsoil quality and quantity, costs, and the feasibility of removal and storage. Topsoil recovery is an expensive operation requiring knowledge of basic soil attributes. For this reason, it is a good idea to conduct a soil survey or assessment of those locations that will be disturbed. An example of soil and site information commonly collected for topsoil recovery is shown in Table 3-13. The road in this example is planned through undisturbed forested lands. Soils data is collected every 50 meters (at road stations) due to the high variability of the soils in this area. Where soils are very uniform, distances between plots can be increased. Soil texture, rock fragments, and depth of the topsoil are measured in the field. At selected intervals, or on different soil types, a sample is collected for lab analysis.
During topsoil survey, note other site attributes that could affect the quality of topsoil, especially the locations of all noxious weeds. These weeds can be treated or removed prior to topsoil salvage or the weed-infested areas can be avoided to prevent the spread these weeds across the project area.
The outcome of the topsoil survey is a short report and map in the revegetation plan showing the areas and depth to salvage topsoil. The report discusses the fertility of the topsoil, how it should be stored, and whether the duff and litter are removed and stored separately. The report also identifies areas where topsoil should not be collected, such as areas of noxious weeds or high rock. The volume of topsoil can be calculated based on soil depth and area of the road prism.
Table 3-13 | Example of a form for collecting topsoil information
| |
Plot number |
| |
C1
|
C2
|
C3
|
C4
|
C5
|
|
Location
|
1 + 300
|
1 + 350
|
1 + 400
|
1 + 450
|
1 + 500
|
|
Site Condition
|
Undisturbed
|
Undisturbed
|
Undisturbed
|
Undisturbed
|
Undisturbed
|
|
% Slope
|
30
|
45
|
35
|
45
|
40
|
|
Aspect
|
N
|
N
|
NE
|
S
|
S
|
|
Topsoil depth
|
12”
|
14”
|
14”
|
6”
|
6”
|
|
Topsoil texture
|
Loam
|
Loam
|
Loam
|
Loam
|
Loam
|
|
Topsoil % rock
|
30
|
25
|
20
|
40
|
45
|
|
Subsoil texture
|
Sandy loam
|
Sandy loam
|
Sandy loam
|
Clay loam
|
Clay loam
|
|
Subsoil % rock
|
40
|
35
|
45
|
45
|
35
|
|
Total soil depth
|
> 60”
|
> 60”
|
> 60”
|
> 40”
|
>40”
|
|
% Soil cover
|
100
|
100
|
100
|
100
|
100
|
|
Soil surface cover
|
Litter, duff
|
Litter, duff
|
Litter, duff
|
Litter, duff
|
Litter, duff
|
|
Depth of cover
|
1”
|
1”
|
2”
|
0.25”
|
0.25”
|
|
Parent material
|
Granite
|
Granite
|
Granite
|
Basalt
|
Basalt
|
|
Fracturing
|
Massive with some fracturing
|
Massive with some fracturing
|
Highly fractured
|
Highly fractured
|
Highly fractured
|
|
Sample depth
|
0-14”
|
0-14”
|
0-14”
|
0-14”
|
0-14”
|
3.10.2 DUFF AND LITTER
Duff and litter are the dead plant materials that have accumulated on the surface of the soil. The level of decomposition differentiates litter from duff. Litter is the layer of recently fallen, undecomposed leaves, needles, and branches; duff (which occurs immediately below the litter layer) is litter that is decomposed beyond recognition. The duff layer is a dark, light-weight organic layer. It is a large reserve of nutrients and carbon, and has a high water-hold capacity. Litter and duff layers protect the soil from erosion by absorbing the energy of rainfall impact and reducing overland flow. Combined, the litter and duff layers can be very thick, ranging from 1 to 4 inches depending on the productivity and climate of the site.
Litter layers typically have viable seeds originating from the overstory vegetation. Under the right conditions, these seeds will germinate. If collected, stored and reapplied correctly, this natural seed bank can be used as a seed source. Litter and duff layers can also contain mycorrhizal inoculum.
Litter and duff layers can be assessed concurrently with topsoil surveys by measuring their depths using a ruler. Refer to Section 5.2.3 (see Litter and Duff), for a discussion of methods for collection and application.
3.10.3 SUBSOIL AND PARENT MATERIAL
Certain subsoils and parent materials can be salvaged during road construction and used to produce manufactured topsoil (Section 5.2.4, see Manufactured Topsoil). Textures low in rock content, including sandy loams, silt loams, loam, and sandy clay loams, are often good materials for manufactured soils. These are often found in areas where the parent materials are derived from alluvial or windblown deposits. They include river sands, pumice, volcanic sands, and loess.
3.10.4 WOODY MATERIAL
Woody material consists of live and dead plant materials that are cleared in the early stages of road construction. This material includes tree boles, root wads, bark, and branches. During clearing and grubbing, these materials are often concentrated in piles and burned. All of these materials can be ground up as shredded wood and used as surface mulches (Figure 3-84) (Section 5.2.3, see Shredded Wood) or soil amendments (Section 5.2.5). Large wood can be used for biotechnical engineering structures, obstacles for erosion control, or placed upright or on the ground for pollinator habitat and site productivity. Substituting shredded wood derived from these materials for composts and soil amendments can lower overall project costs.
Suitable plant materials are often destroyed during road construction. These consist of seeds (Section 5.3.1), plants (Section 5.3.3), and cuttings (Section 5.3.2). If these materials are collected from the construction site prior to disturbance and stored correctly, they can be used, instead of propagated or purchased plant materials, to revegetate the project. Surveys of the project site prior to construction will indicate the location and abundance of appropriate plant materials.
Back to top
3.11 DEVELOPING A VEGETATION MANAGEMENT STRATEGY DURING PROJECT DESIGN
3.11.1 INTRODUCTION
During the planning phase, it is important to consider how vegetation will be maintained after the road project is completed. The effects of road surface and roadside vegetation management can have unexpected and often, unwanted effects on the long-term outcome of the revegetation project. Developing a written maintenance strategy can assure that there will be a rational documented approach to the management of roadside vegetation long after the project is completed and can be used to gain acceptance of the strategy from the maintenance department.
The intent of a maintenance strategy is to consider how the results of a revegetation project will affect the management and maintenance of the roadside and to incorporate this understanding into the revegetation plan. The strategy also anticipates and mitigates for those biotic and abiotic factors that may affect the development of native plant communities and pollinator habitats. Ideally, the planning team or designer meets with local roadside maintenance personnel to discuss their current and future anticipated maintenance procedures in order to learn what problems can be expected in reestablishing roadsides with native plants and how these problems could be addressed. This is a time when maintenance personnel can raise concerns and then work collaboratively with the design team to develop solutions. The planning phase is a good opportunity to develop a plan that maintenance personnel will understand and support.
The intended audience for this section is the designer and design team because they will integrate road maintenance and operations into how to achieve the long-term revegetation objectives during the planning process. Chapter 7 also covers vegetation management but from a maintenance perspective and the intended audience for that chapter is maintenance and operations staff. Chapter 7 focuses on approaches to road surface and roadside maintenance that will meet revegetation objectives after the revegetation project is completed.
A vegetation maintenance strategy may cover some, or all of the following:
- Protection of areas currently free of invasive species
- An outline of an integrated vegetation management approach to weed control
- How existing weeds may be controlled prior and during construction
- How a weed-resistant road environment will be created
- How roadside vegetation maintenance objectives will be achieved after construction
- How the vegetation maintenance strategy is handed off to maintenance personnel
- How roadside disturbances will be treated during the maintenance phase
3.11.2 INTEGRATING ROAD MAINTENANCE OBJECTIVES INTO THE REVEGETATION PLAN
For a successful project, it is important that road surface and roadside maintenance objectives align with treatments and species outlined in the revegetation plan. Many states have developed IRVM (Integrated Roadside Vegetation Management) Plans that outline roadside maintenance objectives. When available, it is strongly recommended that the designer refer to these individual plans while developing the revegetation plan. The IRVM plan is “an approach to right-of-way maintenance that combines an array of management techniques with sound ecological principles to establish and maintain safe, healthy and functional roadsides” (Brant et al 2015). It applies many of the Integrated Pest Management concepts developed for agriculture, horticulture, and forestry to roadside vegetation management. The IRVM elements include prevention, monitoring, action thresholds, pest treatments, and evaluation (NRVMA 1997). Most of these plans are available on the internet or by contacting the state DOT or the local maintenance agency.
A vegetation management strategy considers how road maintenance objectives are integrated into plant species selection, planting patterns, vegetation control, invasive species control, and site treatments. Typical road objectives are stated below, along with their possible effects on roadside vegetation. In the development of the vegetation management strategy, consider how each objective will affect vegetation and, in turn, how vegetation treatments and design will affect roadside objectives.
- Maintain line of sight—It is important to not plant masses of tall grasses, shrubs or trees in areas where line of sight is important. If they are existing to remain on a site that is being revegetated, they may need to be maintained or removed and replaced with appropriate smaller plant material so as not to reduce line of sight. Designing for safety is further discussed in Section 3.11.7.
- Maintain clear zones—The FHWA (2017) defines the clear zone as “an unobstructed, traversable roadside area designed to enable driver to stop safely or regain control of a vehicle that has accidently left the roadway … and an effective strategy for prevention and mitigation of roadway departure crashes.” The publication further states that “trees are the single most commonly struck objects in serious roadside collisions. Therefore, it is important to integrate the selection of appropriate plant species with safety objectives in mind.” The integration of habitat features such as brush piles or dead wood are to be placed well beyond the clear zone.
- Maintain road surface—Encroaching vegetation can reduce the longevity of road surfaces. Selecting plant species that are least likely to do this can preserve the longevity of roads.
- Reduce fire hazards—One of the reasons for maintaining low growing roadside vegetation is to reduce the starting of fires by motorists and the spread of wildfires. In planning, choosing plants that are more fire resistant and encouraging plants that stay green in the summer (e.g. native perennials) by creating good optimum growing environment (e.g. good soil conditions). Mowing, herbicides, grazing, and fire are also measures that may affect pollinator habitat and need to be planned accordingly (Section 7.5).
- Maintain stable roadside—Cuts, fills, and drainage facilities need to be maintained so that they are stable. When they are not, they create road hazards and degrade water quality. Unstable material will need to be removed and replaced. The removal area and replacement material will need to be reviewed and revegetated. Areas that fail will also need to be repaired and revegetated. It is important that the maintenance provider have the native-sourced seeds or plants for the waste or disturbed areas (Section 7.2.2).
- Maintain or increase water quality—Maintaining water flow off pavements, down ditches, and into natural waterways is important for road maintenance but may affect water quality or plant growth. Cleaning out ditches affects plants and cut slopes. Poor flow of water off pavements can cause rill and gullies on fill slopes affecting plants. Poorly designed culvert placement can cause downcutting of natural drainage channels.
- Reduce or eliminate invasive species—Controlling invasive species may also negatively affect non-target plants and pollinator species and need to be considered when developing treatments. (Section 7.5).
- Maintain safe road surfaces during winter months—Winter roadway surface treatments vary throughout the country. Gravels used in mountainous, heavy snowpack areas, coarse sand used in smaller urban areas, and the more prevalent deicing chemicals Can be the most devastating treatments on roadside vegetation. Sweeping gravels off pavement during melt periods buries roadside plants. Reusing gravels from along roadsides can spread weeds. Blowing snows can create drifts that melt later in the year and may call for different plant species in those areas to withstand that condition. Sand accumulations in swales and drainage structures can create clogs, ponding, and spreading sand bars which can smother groundcover over time. Deicing with salts and other chemicals can kill or reduce growth on certain plant species. This is further discussed in Section 3.11.9 (see Deicing for Winter Safety).
- Reduce impacts of wildlife to motor safety—The selection of plant species and where they are planted along roadsides can affect how wildlife moves through a road corridor and their potential hazards to motorists. Planning for wildlife is an important consideration when selecting plant species and planting patterns. Providing desirable browse or a refuge of thick vegetation on both sides of an identified animal crossing can draw wildlife to the safe crossing location. Existing vegetation near known unsafe animal crossing locations may be controlled through removal, thinning, and mowing to reduce cover and forage opportunities, and to increase visibility in an attempt to reduce animal-vehicle collisions. Vegetation types, patterns, and maintenance can encourage the movement of wildlife to crossings. Wildlife fencing that direct animals to grade separated crossings are very successful in reducing wildlife-vehicle collisions (WVC). Consider planning the fencing with wildlife biologists who are familiar with wildlife passage patterns.
- Protecting utilities—Encroaching vegetation can overgrow and hide utility structures, which may lead to accidental damage during maintenance procedures, may affect maintenance access, and may cause maintenance review to be missed. Utility service may also be damaged and disrupted by accumulation of heavy vines, wind-blown branches, and by falling trees or branches. It is important to that species that may interfere with utility access and protection are not planted near these structures.
The vegetation management strategy will ideally span the entire length of the project, into the operation and maintenance phase (Chapter 7). In the early stages of planning, weed sources are identified and treatments to control or eliminate often begin prior to construction (Section 3.11.6). Areas of functioning plant communities, relative free of invasive species are identified and plans for protection are developed (Section 3.11.3). During planning, road maintenance objectives are integrated into the revegetation treatments. As the project moves into construction, treatments to create a weed-resistant environment (Section 3.11.4) and measures to reduce the introduction of weed sources are implemented (Section 3.11.5). Once construction is completed, the project is handed off to the agency responsible for road maintenance. At this point, the responsible agency implements their vegetation maintenance plan which dovetails with the revegetation plan objectives (Chapter 7).
Weed species are often brought onto the site from outside sources such as construction equipment, mowing equipment, cars and trucks, shoes and socks, and in materials used on the project such as gravel and rock. All too often, weeds arrive during the revegetation efforts in contaminated mulches, topsoil, hydroseeding equipment, and uncertified seed sources. Making the effort to prevent the introduction of weed propagules onto the project is always the preferred strategy because it is easier and more economical to prevent the introduction than to control or eliminate weeds once they have become established. There are many possible entry points for weeds:
- Vehicles and equipment—Weeds seeds and plant parts can arrive during construction on vehicles and equipment. Portable wash stations are often set up at staging areas and/or designated site entrance/exit points to thoroughly clean tires, wheel wells, and chassis of vehicles and equipment to reduce the possibility that weed seeds are brought in from other projects or areas or transferred within a project area.
- Erosion control seeding—Rye grasses are non-native and commonly used for temporary or permanent erosion control seeding. Seeds of these species are also found in material used for wattles. These grasses persist in the landscape and are difficult to eradicate once introduced. Unless these species are required by jurisdiction on the project, other species, such as native grasses used in conjunction with sterile hybrid grass seeds would satisfy erosion control needs and offer greater benefits to the environment. Erosion control matting works well to block the establishment of weeds while preventing erosion and facilitating the growth native plants.
- Hydroseeding tanks, range drills, and other seed delivery systems—Seed delivery systems, such as hydroseeding tanks and range drills, brought in from other projects, can contain plant species that are not wanted on the project. A thorough cleaning and inspection of this equipment are essential to eliminate the potential introduction of unwanted seeds. It is recommended that hydroseeding tanks are washed out and range drills air-blown before this equipment is brought on the project site.
- Seed sources—Commercial grass and forb seed sources, whether native or non-native, can contain weed seeds that were harvested along with the native seeds. The quantity of this material is dependent on the weed control practices and seed cleaning technology implemented by the seed producer. A good means of eliminating the possibility of contamination of native seeds with weed seeds, is to ask for seed tests of the seed being considered for purchasing. The purity seed test identifies the contaminants in a seed lot, including weed seeds, other plant seeds, and inert material. It is important to ask for tests that determine the presence of state-listed noxious weeds and other crop species (check state and federal lists to determine if any local weed species should be added to the testing list). Testing is conducted through certified seed labs per the standards of the Association of Official Seed Analysts. If the seed is not cleaned and retested, the seed lot can be rejected.
 Figure 3-85 | Hay often contains weed seeds
 - Hay bales often contain seeds from unwanted species that will germinate once the hay is spread. Some states have certified “weed-free” programs, however, “weed-free” does not mean the hay will be seedless.
Photo credit: David Steinfeld
- Mulches—Buy mulch that is free of weed seeds. Hay and straw mulches are of special concern (Figure 3-85). Some states certify hay or straw as “weed-free” which means that the material is free of noxious weeds but not necessarily free of all seeds. Some straw comes from the stubble left after a seed harvest of native and non-native grasses, which often includes unharvested seeds. These seeds are viable and will establish into plants when the straw is applied. A site visit or discussion with the vendor prior to purchase is a good way to assess if there are seeds of unwanted species in the material.
- Compost sources—Compost sources are not always free of weeds, especially if the materials were not composted properly. Compost has to reach lethal temperatures and remain there long enough for plant seeds to be rendered nonviable. Fresh, moist compost piles, where temperatures are maintained between 140 to 160 degrees F for at least several days, will kill most pathogens and weed seeds (Epstein 1997; Daugovish et al 2006). When obtaining compost, it is important to ensure that the supplier complies with standards that meet the time-temperature requirements to ensure destruction of weed seeds. Visiting the mulch sources or testing mulch for weed seeds may also be appropriate prior to purchase (Section 5.2.5).
- Gravel, sand, and rock sources—Prior to acquiring road building materials such as sand, gravel, and rock, determine if this material comes from a source that is free of undesirable weeds. A plant survey of the source area will identify whether the material is suitable.
- Haul routes and waste areas—Haul routes and waste areas can have weeds that may be transported around the project on vehicles and equipment. It is recommended that these areas be treated prior to construction or avoided during construction to reduce this risk.
- Salvaged and purchased topsoil—During the survey for salvaging topsoil, areas of weed populations are also typically identified (Section 5.2.4). To reduce the possibility that these weed populations are spread when topsoil is salvaged and reapplied, weed populations are avoided during topsoil excavation. Salvaged topsoil is stored in a manner that limits weeds from becoming established. For topsoil that is being considered for purchase, prior inspection of the piles will assure that the soil is free of weeds (Figure 3-86).
- Sand, gravel, rock, or topsoil storage—Inspect areas where topsoil, gravel, rock, sand, or other materials to be used on the construction project will be stockpiled. If there are weeds growing nearby, it is very likely that seeds will end up on these piles, especially if the piles are to be stored for over a year. Good practices are to remove these populations prior to stockpiling materials and to require stockpiles be maintained free of weeds.
- Hedgerows and windbreaks—Planting windbreaks with non-native species, such as autumn olive, privet, honeysuckle, buckthorn, and multiflora rose, introduces fast-growing, highly competitive species (Harper-Lore et al 2013). Use of native species is preferable.
- Livestock grazing—Cattle can bring weed seeds from offsite where they have been grazing. Until native vegetation has become established, it is important to keep livestock out of the area.
3.11.6 CONTROLLING UNWANTED VEGETATION
Stratifying the Project by Weed Status
Locating weed populations early in the planning phase will help in developing a successful vegetation management strategy. During the initial vegetation assessment (Section 3.6.1) and topsoil surveys (Section 3.10.1), weed populations are typically identified and mapped to produce a weed status map.
The weed status map is typically composed of these 4 mapping units:
- State-listed noxious weeds—Areas where state-listed weeds are present and regulations require their control.
- Species of concern—Areas where species of concern are present. These are plants that are known to occur within the area, are not regulated for treatment by the State or County, but cause concern due to their population density, life strategies that provide them with a competitive advantage over desired native plants, dense growth in waterways, affinity for habitats specific to those required by desired specialist plant species, toxicity or ability to cause injury to livestock, etc. If the resources are available, the implementation of a new project can often provide a great opportunity to treat these species.
- Weed-free, non-functioning plant communities—These are areas where there is no state listed noxious weeds or species of concern present, but the plant communities are composed of exotic species, monocultures, poor pollinator species, or have depauperate plant communities with a large proportion of bare ground.
- Weed-free, functioning plant communities—Areas where a suite of native plant species is present, soils are intact, and there are minimal noxious weeds or species of concern present. These are optimum habitats for pollinators and larger areas may be wildlife refugia as well (Section 3.11.3).
Understanding the Life History
Understanding the life history and ecology of the regulated noxious weeds and species of concern of the project area is important in developing a weed control strategy. There are several resources to learn about specific noxious weeds or invasive species. The USDA PLANTS database describes each weed species and has PDF documents called Plant Guides that detail the life history of the weed and how it can be controlled. Another source of information is the Invasive Species Assessment Protocol (I-Rank) website and covers many of the nonnative plants in the United States. This website describes some of the important characteristics of the weed species and ranks each on its threat to native plant communities and its difficulty to control. Because these websites are frequently updated, it is important to check the most current lists. Local County Weed Boards and county and State road maintenance staff are also good sources of weed information, as they track and treat specific weed species, often within the project area.
The important information to have about each weed species in the project area includes:
- Life form
- How it reproduces (i.e. vegetatively, by seed, both)
- Viability and longevity of propagule
- Reproductive period
- Mechanism and distance of propagule dispersal (i.e., wind, animal/bird/insect, explosive seed capsules)
- Life/growth strategy
- Life cycle
- Limiting factors to establishment
- Importance to pollinators
- Treatment options
Based on the ecological requirements and life history information, weeds can be grouped into two treatment groups: (1) species that are treated prior to, and during, construction (Section 3.11.6, see Weed Control during Pre-Construction and Construction Activities) and (2) species that are treated after construction (3.11.6, see Post-Construction Weed Control and Vegetation Management).
Weed Control during Pre-Construction and Construction Activities
Construction activities often occur during the time that seeds are ripening or beginning to disperse, which increases the potential that unwanted seeds will be scattered throughout the project area. To effectively treat some state or county listed weeds and species of concern, it is often optimal to treat prior to, and during, construction. These species include:
Species with wide seed dispersal—These are species that spread seeds long distances, which can be achieved by a number of methods. Some plants have structures that forcibly eject seeds when disturbed or at maturity employ ballistic dispersal (e.g., brooms [Cytisisspp.), bittercress (Cardamine spp.), jewelweeds (Impatiens spp.]). Ballistic seed dispersal can often provide propagation advantage to shorter plant species.
 Figure 3-87 | Examples of plant seeds adapted for wind or gravity dispersal
 - Yellow salsify (
Tragopogon dubius) (A) is just one example of many plants within the Aster family that develop white, hairy pappus to facilitate airborne flight of seeds on the wind. The Siberian elm tree (Ulmus pumila) (B) develops a papery membrane around its seeds to assist their dispersal by gravity and wind.
Photo credits: (A) Jane Shelby Richardson, (B) Steve Hurst
Additional seed dispersal mechanisms that allow transport are gravity and wind dispersal (Figure 3-87). In general, the taller the plant, the further its seeds are dispersed. Plants that utilize wind dispersal frequently have appendages on their seeds (more often this would be fruits) to aid movement via wind. Yellow salsify (Tragopogon dubius) is an example in the aster family that employs wind dispersal, while the elm (Ulmus pumila) is a well-known weedy tree species in many areas that utilizes gravity and wind dispersal.
Bird and insect assisted dispersal is another strategy that facilitates movement of plant propagules across considerable distances. Seeds or fruits may stick to the feet or body of an animal and be transported as they walk or fly. Seeds can also stick to the feet of humans, including restoration designers and implementers. Animals can consume the seeds of plants, depositing them at new locations once the seeds pass through their digestive systems. Animals and insects often actively move seeds or vegetative material from one location to another to utilize them as an immediate or stored source of food or nesting material. Humans move the seeds of many of these species when walking and driving as well.
Any non-native plant species that disperse their propagules substantial distances from their source are ones for which pre-construction treatment could be considered.
Vine species—Species that form vines [e.g., English ivy (Hedera helix) and kudzu (Pueraria montana var. lobata)] are of concern when they are attached to trees that might be transported from one location within the project to another. If the trees are felled and skidded for removal from the project site, or for use for wildlife habitat, stream restoration, erosion control, or other practices on site, pretreatment of the vines is essential. Unless the vining plants are effectively killed prior to felling, the movement of the tree will spread seeds and vegetative parts of the vine across the construction area. This often necessitates treatment for at least one season prior to construction.
Species that propagate vegetatively—Many species spread vegetatively from portions of roots, stems, or both [e.g., Himalayan blackberry (Rubus armeniacus)]. If there is no control prior to construction, whole plants or fragments can be moved during soil excavation, clearing and grubbing activities, and movement of equipment with the result that the species will establish in disturbed areas. Because of the potential spread and tenacity of some species, the objective is to eliminate the risk of spread by the end of construction. Possible treatments include:
Applying herbicides—State and local laws, including labeling laws, describe how herbicides are to be used. Additionally, site specific stakeholders might have policies or regulations for herbicide use and their consultation can be very helpful. Herbicides affect plant species through a number of mechanisms such as disruption of cell division, regulation of growth, stopping photosynthesis, and many others. When possible, attacking the weed species through more than one mechanism will prove most effective. Most species that are considered weeds tend to spread readily and respond more vigorously following ground disturbance than many native species. Due to these factors, systemic herbicides are often desirable. The herbicide(s) used will be determined by regulations, the target treatment species, phenology of target species, tolerance for collateral damage to desired species, season of year, deadline for treatment, and more.
Applying herbicides and mastication—A strategy that has proven effective for monocultures of aggressive weedy species, such as Himalayan blackberry in the northwest, is to treat the plants with a combination spray of herbicide, followed by mastication or mowing, and then retreatment with herbicides. The herbicides used combine mechanisms of action as described above and are allowed to translocate for three to six weeks, depending on conditions and herbicides utilized. Once the herbicides travel through the plants’ tissues, the above ground shoots are mowed to approximately two to four inches high. The shoots are then allowed to grow until sufficient leaves are developed so that another treatment of herbicide can be conducted. By doing this the plant has been attacked from a number of pathways: 1) multiple mechanisms of action through the herbicides used; 2) reduction of the photosynthetic material; 3) reduction of the seed source; and 4) eventual starvation of root tissue.
Scraping and removing—In cases when herbicide use is not desired or allowed, or when there is not sufficient time to conduct treatments, removal of the non-native weed species can be employed. The undesired plants can be scraped from the site during the clearing and grubbing process and buried at an agreed upon location or hauled off site to an approved facility. If an on-site spoils or waste area is to be used, it is important to include language in the special contract requirements to address the specific needs for containment. This often includes the prevention of further mixing or movement of soil once the weeds are placed, and installation of a “cap” of clean fill dirt on top of the weedy species.
Hand removal—If weed infestations are relatively isolated, have patchy distribution, or are in small populations they can often be removed by hand.
Post-Construction Weed Control and Vegetation Management
Most unwanted vegetation can be treated after construction through revegetation contracts, however, long-term vegetation management is typically conducted by road maintenance personnel within a statewide Integrated Vegetation Management (IVM) plan or an Integrated Roadside Vegetation Management (IRVM) plan. Treatments, when they are selected through a decision-making process, include mowing, applying herbicides, mechanical removal, hand-pulling, grazing, fire, and biological control. A discussion of post-construction vegetation management is presented in Chapter 7.
For areas that have been identified as weed-free, functioning plant communities (Section 3.11.6, see Stratifying the Project by Weed Status), it will be important to maintain these areas in a sustainable manner. An approach to maintaining these areas is outlined in Section 7.2. Although hand removal can be labor intensive it is a great opportunity to involve community volunteers once construction activities have been completed.
For weed-free, non-functioning plant communities, it is important to decide whether to enhance the current plant community or accept the existing conditions and conduct no additional work. If enhancement is desired, contract components can be included to augment existing native plants to increase competition or to reset community succession, treat surrounding non-native plants, treat the soil to better support native plants, alter the light regimen to better support natives, and improve water drainage.
3.11.7 DESIGNING FOR SAFETY AND UTILITY PROTECTION
Planting treatments along roadsides are limited by National Highway System (NHS) design standards and road development best practices guidelines provided by the American Association of State Highway and Transportation Officials (AASHTO) which are adopted by its member State departments of transportation (DOTs). Designers can find guidance on roadside revegetation treatments in key AASHTO guidelines that include the Roadside Design Guide, A Policy on Geometric Design of Highways and Streets (Green Book), Guidelines for Geometric Design of Very Low-Volume Local Roads, and A Guide to Achieving Flexibility in Highway Design. The design guidelines give minimum highway/rural roadside clear zones and urban streetscape horizontal clearances or operational offset distances recommended for motorist safety. The zone distances from edge of travel lane or edge of roadway pavement are determined based on traffic volume, road speed, vertical alignment, and roadside slope conditions. Clear Zones are defined as unobstructed, traversable roadside area that allows driver to stop safely, or regain control of a vehicle that has left the roadway (Figure 3-88) (FHWA 2008(B)).
- Hinge Point—Point where the slope rate changes
- Clear Zone—A traversable area that starts at the edge of the traffic lane, includes the shoulder, and extends laterally to sufficient distance to allow a driver to stop or return to the road before encountering a hazard or overturning.
Vegetation Treatment Zones (VTZ) are designations used by many DOTs to describe the vegetation coverage and maintenance requirements at certain distances off of the edge of roadway. VTZs typically correspond to highway clear zone distances. The VTZ dimensions, vegetation, and maintenance treatments vary by State and roadside conditions, but generally, DOTs have adopted a 3-zone treatment approach (Figure 3-89), (FHWA 2008(B). Zone 1 generally extends from the edge of pavement to the drainage ditch along the roadway and is composed of low native grasses that are regularly mowed. Some DOTs mow this area less frequently and some choose to spray it with herbicide to eliminate plant growth entirely. Zone 2 extends across the drainage ditch and a few feet beyond, and is composed of grasses, forbs and low shrubs. Maintenance of zone 2 is focused on maintaining drainage and removal of tree species. Zone 3 extends from Zone 2 out to the edge of right-of-way and may be covered with grasses, forbs, shrubs and trees outside of prescribed safety distances. This area is generally not mowed and may contain large shrub and tree species outside of the clear zone. Maintenance for all zones consists of removal and control of invasive plant species and removal of tree species within safety distances.
Clearance for “Line of Sight” and Safety—Trees and shrubs are often thinned or removed in areas where roadway or roadside line-of-sight is impeded. Good communication with the government agency responsible for maintaining the road during the planning phase will help identify those areas not suitable for shrub and tree species. Native grasses, forbs, and low growing shrubs (3 feet tall or less) can provide durable groundcover for these areas and not affect line-of-sight or motorist safety.
Trees Management Location—Trees that reach 4 inch diameter at breast height (DBH) are typically considered immovable objects that can cause heavy damage, injuries, and loss of life in a vehicle crash. According to a study in 2005, more accidents occur between 0 and 12 feet from the travel lane with significantly less between 12 to 30 feet (Mok, Landphair, Naderi, 2006). Tree masses close to the roadway can provide cover for large mammals and can contribute to WVCs. DOTs typically will not allow tree species in clear zones, unless they are protected with guardrail. Best practices for WVC reduction includes full tree and shrub removals or strategic thinning out tree and shrub masses close to the roadway in order to remove desirable cover for ungulates and to open views for motorists to see potential wildlife hazards.
Protection of Utilities—Planting of large trees under power lines can lead to damage of utility lines during wind and ice events and can make line maintenance access difficult and dangerous. Coordination of the roadside revegetation plan with the utility agencies of jurisdiction can identify utility easements, planting requirements, utility maintenance access needs, and additional utility accommodations.
3.11.8 DESIGNING TO ISOLATE WILDLIFE FROM VEHICLES
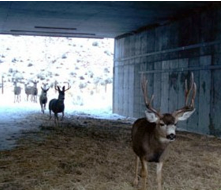 Figure 3-90 | Mule deer using an underpass
 - Deer are frequently involved in WVCs. Early planning and thoughtful design of undercrossings and overpasses can encourage wildlife use and enhance safety for wildlife and motorists.
According to a 2008 U.S. Department of Transportation study, “there are an estimated one to two million collisions between cars and large animals every year in the United States”…”commonly or typically…with deer (mule deer and white-tailed deer combined)…near forested cover and drainages.” (U.S. DOT, 2008). The collisions often kill the wildlife and can cause high damage expenses, injuries, and even loss of life for the driver. New roadway corridors inevitably intersect wildlife crossings. The analysis of the local wildlife population, their traffic patterns, proximity of their habitat fragments, and any data on area wildlife-vehicle collisions (WVCs) in the pre-budget planning stage can inform the designers on the roadway design features to consider in order to reduce the probability of future WVCs along the corridor. It is important to keep animals out of roadway corridors but to also plan for their safe crossing above or below the roadway (Figure 3-90). Preservation and enhancement of wildlife corridors under or over roadways can be an effective method for reducing WVCs. Natural wildlife corridors often occur along creeks, rivers, and along drainage swales, features that can be preserved through the use of natural bottom culverts or clear span roadway bridge structures. Design of wildlife crossings to accommodate the needs, preferences, and tendencies of the animals that may use the crossings can maximize the likelihood of use and increase safety for all involved.
The design considerations vary with each project location. The FHWA has produced two best practices manuals for designers of roadway corridors and wildlife crossings entitled, Wildlife Vehicle Collision Reduction Study (Huijser, 2008) and the Wildlife Crossing Structure Handbook Design and Evaluation in North America (Clevenger/Huijser, 2011). Each contain recommendations based on specific studies of wildlife interactions with various wildlife crossing structures, treatments, and conditions.
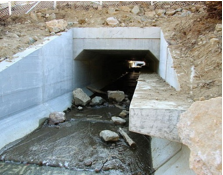 Figure 3-91 | Culvert with highwater ledge for small mammal crossing
 - Maintaining safe access to habitat, including during high water periods can enhance safety for wildlife and motorists and also keep the food chain functioning.
Photo credit: Unknown
Wildlife crossing design for motorist safety will typically focus on accommodations for the largest most prevalent animals in the area, often deer. Designing for a variety of wildlife considerations may necessitate greater culvert or bridge clearance height and span length at each crossing, small tunnels for critter crossings, high-water crossings inside culverts (Figure 3-91), hundreds to thousands of feet of tall wildlife exclusion fencing or wildlife friendly/game fence that allows one-way animal pass through/pass back from the roadway (Huijser, Kociolek, McGowen, Cramer, and Venner, 2015), specific plant material to attract and guide animals to the crossing, or a combination of these measures. As the crossings directly impact the budget for the roadway project, and impact the safety of the public who will use the roadway, it is recommended that their evaluation and planning begin at the early planning stages of a new roadway alignment or bridge/culvert replacement project and that the revegetation expert be involved throughout the process.
Suitable habitat on both sides of the road is a necessary condition for all wildlife to cross, and areas with the highest quality habitat will often have the highest rates of crossing (Barnum 2003). Distance to cover is another factor that affects wildlife crossing use. Small animals prefer plentiful and consistent cover before and, if possible, through an undercrossing. Deer and elk tend to prefer crossing in open areas away from forest cover, especially during the winter (Clevenger and Waltho 2005; Barnum, Rinehart, and Elbroch 2007). Other animals prefer a more balanced composition of cover and open space while most carnivores prefer a dense forest cover.
Roadside revegetation design provides the opportunity to support safe wildlife crossings by creating a roadside planting and maintenance plan that will reduce animal browsing within the ROW, and provide planted conditions that will attract wildlife to the crossing points. Open views to vegetation beyond the undercrossing will encourage animal movement through the crossing to the other side, and continue on to wildlife corridors or refugia beyond. Ungulates, or hoofed mammals, especially deer, are browsers that prefer fresh new growth. Spring growth and new growth after cutting and mowing maintenance will attract ungulates and encourage them to linger and graze. Increasing mowing maintenance at wildlife undercrossings may increase more regrowth periods that can draw browsers to the crossing locations. Reducing the quantity of roadside mowing events away from undercrossings and strategically timing mowing operations to late fall or very early spring, can reduce the number of mass new growth events that draw ungulates to browse along the ROW.
Study results for vegetation control effect on WVCs indicate that flatter ROW side-slopes and lower vegetation along the roadway can improve driver safety and discourage use by large wildlife. Low plant material is less desirable for use as cover by ungulates, and opens up view-sheds so drivers can potentially see animals in the right-of-way (ROW) and allow time to react and slow down to avoid wildlife-vehicle collisions. Plant material 3 feet tall or lower, not counting seed head stalks that may rise taller late in the year is generally considered low. Elimination of large trees from roadway clear zones can remove desirable wildlife cover from the ROW and immovable tree trunks that can damage vehicles and injure motorists that leave the roadway.
Wildlife over-crossings are still rare in the United States but are preferred by ungulates and other species more than under-crossings. Ungulates and other species will use under-crossings if they appear open and free from predator hiding places. They generally prefer level open space leading up to the crossing, a generous tall and wide bridge span or box culvert, natural low vegetation or soil walking surface, and clear views to open space on the other side.
Easy access to wildlife crossing locations can increase their use. If an existing ROW fence exists beyond the wildlife crossing area, it is recommended that portions of fence be removed if possible. In the case of cattle or other livestock use outside of the ROW, a section of fencing may be replaced with a gate that remains open when the field is not occupied. Additionally, wildlife friendly adjustments may be made to the top and bottom strands of barbed wire, such as adjusting the wire spacing and/or replacing with smooth wire on the top and bottom to protect wildlife that jumps over or crawls under the fence.
High-use crossing locations and those with narrow rights-of-way may need the addition of protective traffic barrier and guardrail and/or lengths of tall animal fencing to help encourage animals back down to the under-crossing. Resources that provide wildlife control methods to consider for specific site conditions include Best Management Practices for Wildlife Corridors (Beier, 2008), Wildlife Vehicle Collision Reduction Study (Huijser, 2008), the Wildlife Crossing Structure Handbook Design and Evaluation in North America (Clevenger/Huijser, 2011), Construction Guidelines for Wildlife Fencing and Associated Escape and Lateral Access Control Measures (Huijser, et al., 2015), and Implementing Measures to Reduce Highway Impacts on Habitat Fragmentation (Louis Berger Group, 2011).
Experts recommend that wildlife crossings remain open and clear overnight, during the construction process if possible. They also recommend these areas be completed and planted as early as possible in order to reduce animal stress and to keep them from learning new less desirable places to cross the roadway. Supplemental hay and salt licks may also be used to encourage continued crossing use during construction; supplemental feeding may then taper off over a few months after construction.
Plant selection for wildlife crossing locations can be approached as seeded roadside pollinator habitat development supplemented with low native forbs and grasses that are preferred by wildlife for food and browse.
3.11.9 DESIGNING FOR DISTURBANCES
Disturbances that affect roadside vegetation often occur after plants have become established. While some of these disturbances are unforeseen, others can be expected. The designer may want to consider what disturbances can be expected and how they may be mitigated within the design of the roadsides and revegetation plan.
Deicing for Winter Safety
Approximately 70 percent of the roads in the US are in snow regions (FHWA 2012) that may require deicing practices to make them safe and passible during winter periods. Most deicing materials contain chloride-based salts which, when applied road surfaces, lowers the freezing point and melts snow and ice. Solid salt (NaCl) is the most common product used, following by calcium chloride (CaCl2), magnesium chloride (MgCl2), potassium acetate (KAc) and calcium magnesium acetate (CMA) flakes for bridges (AASHTO 2013). The suggested rate of NaCl is 100 to 300 pounds per lane-mile (Salt Institute 2008).
Potential Impacts to soils and vegetation—Deicing materials can pose a risk to soil properties and plant growth. Salt concentrations in roadside soils correlate positively with salt application rates (Jones et al 1992) and high levels of sodium disperse soil organic and inorganic particles, reducing soil permeability and increases runoff (AASHTO 2013a). The negative effects on plant growth, however, are often associated with road spray on plant foliage rather than presence of salts in the soil. Roads that are treated with deicing materials does not preclude that plants on adjacent roadsides will be affected. The effects of road salts on soils and plant depend on the:
- Sensitivity of plant species to salt—At very high salt levels in the soil, germination of native plant species can be reduced (Harrington and Meikle 1992, Fulbright 1988) or delayed (Ungar 1992) though there is considerable variability between native species. In general, shrubs and grasses tolerate salt concentrations better than trees (Sucoff 1975, Bryson and Barker 2002). And sensitivity among tree species ranges from sensitive to tolerant. In the Lake Tahoe Basin, for example, two and three needle pines (e.g. Jeffrey, ponderosa, and lodgepole pines) show salt damage more frequently than white and red fir (University of Nevada 2009).
- Amount of salt applied annually—The amount of salt damage is related to the total amount of salt applied during the winter. The higher the quantities of salt applied, the greater the effects to soil and plant quality. The University of Nevada (2009) found that the proportion of trees affected by salt damage coincided with the annual quantity of salts applied to the road surface.
- Distance from the road—The highest amount of salts occurs closest to the road and diminishes moving away from the road surface. Ninety percent of salt deposition from road spray often occurs within 65 feet of the roadside (Blomqqvist et al 1999) and it is in this zone where foliar damage such as needle necrosis, twig dieback and bud kill on trees happens.
- Type of salt—The type of deicer may affect plant species differently. Trahan and Peterson (2008) found that MgCl2 was more damaging when directly applied to tree foliage than NaCl. Calcium magnesium acetate was found to be less toxic on certain grass species than sodium based salts (Robidoux and Delisle 2001) and may even improve soil properties by increasing permeability and providing calcium and magnesium for soil fertility (Fritzsche 1992).
- Precipitation—In areas of high precipitation, salts will become diluted and move through the soil profile, reducing the potential negative effects to seed germination and plant growth. In areas of very low precipitation
- Soil type—Soils with low pH values may benefit from some addition of road deicers. By raising soil pH, certain nutrients become more available (Section 3.8.4). Soils already high in sodium could become even more toxic to plant growth with NaCl additions.
Assessing potential impacts of deicing practices —During the planning phase, it may be important to assess the level of impact deicing practices have on native plant establishment and growth after construction. The type and amount of deicing material used on the highway project can be obtained from maintenance and operations records. If the quantities are considered high (Figure 3-47), then it may be beneficial to conduct a field survey of soils and vegetation along a stretch of road in or similar to the project area. The survey area can be stratified into zones parallel to the road alignment because the effects of salts on vegetation composition and health grade from most affected to least affected, moving away from the road. Specific monitoring procedures that may be helpful include Soil Cover (Section 6.3.1), Species Cover (Section 6.3.2), and Species Presence (Section 6.3.3), using a Rectilinear Sampling Area design (Section 6.3.6, see Rectilinear Areas), because the narrow width of each sampling area is not conducive to using transects.
Comparing the differences in each zone may show the effects of deicing practices on vegetation. If there are no differences between each zone, then it can be assumed that deicing practices have no effect. If there are differences, then those differences are taken into consideration when developing seed mixes or soil improvement practices. It may be important to determine if these differences are due to deicing practices or due to other factors, such as mowing, surface contaminants, soils, air pollution, drought, or tree diseases or pests. One method to make this determination is to collect soil samples in each zone and measure soil conductivity using a pH meter (Section 6.3.1). If conductivity readings recorded in the zone next to the road are higher compared to the zone furthest away it would indicate that deicing practices maybe responsible. Refer to Figure 3-47 for interpreting conductivity values that affect plant growth.
Mitigating for deicing practices—If road deicing salts are determined to be detrimental to plant growth, the designer may want to select a species mix that has a higher tolerance for soluble salts. Selecting the tolerant plant species can be determined from information collected during the vegetation assessment (Section 6.3.1). Desirable species growing in the deicing zone are good species to consider in species mixes. The ERA tool may also give some guidance on those species most adapted to high salt environments.
Gravelling for Winter Safety
In areas where gravels are frequently applied to road surfaces during snow or icy conditions, there can be a buildup of gravels on the road shoulders. Vegetation that has been established in these areas is often completely covered with gravel after snow melt. In addition, road maintenance often excavates these gravels to reuse and in the process, removes established plants growing in this zone. The designer will want to design revegetation treatments in these areas according to the expected disturbance. In areas where gravels are not salvaged, the designer may want to select plant species that survive and grow well in this unique growing environment. Some species respond favorably to being covered by gravels. These include species such as manzanita and willows that root from their stems when covered by soil or gravel. Tap-rooted species, such as lupines, can take advantage of such conditions because they can access moisture deep in the gravel deposits (Figure 3-92). A vegetation assessment (Section 6.3.1) of the road shoulders of the project area will identify species that have adapted to these conditions. In areas where gravels are annually removed, the designer will want to identify the width of this disturbance and remove the area from the revegetation plan.
Ditches at the base of steep cut slopes are depositional areas for rock and soil that have moved down from the slopes above. This material fills ditches, disrupting the flow of water and creating potential road drainage problems during storms. Blading is the removal of material that has filled in the ditchline and is a normal maintenance procedure for erosive cut slopes. This operation not only removes plants that were established in the ditchline, but also destabilizes the surface slopes immediately above the ditch which can affect the revegetation of the entire slope. Designing cut slopes so that they are stable is one method of reducing the need to blade ditches. This includes reducing slope gradients near the ditches and establishing a good vegetative cover that resists slope movement.
Recreational Activities
The road corridor is sometimes used for recreational purposes that can disturb established vegetation. This recreation is not usually sanctioned or intended, but it exists in certain areas nonetheless. Recreational disturbances include off-road vehicle travel, mountain bike use, trails to recreational sites, parking, and Christmas tree cutting.
It is important for the design team to identify the public’s demand for recreational activities and to determine how these activities might affect short- and long-term vegetation goals. For example, abandoned roads that have been revegetated are often desirable places for off-road vehicles because they are open and flat. Roads bordering recreation destinations, such as favorite fishing spots, may have demands for access trails or scenic views that the public does not want blocked by tall vegetation. Public scoping often identifies these needs. There are several approaches to mitigating the effects of recreational impacts, most of which are forms of awareness, protection, and exclusion. Intruders can be excluded physically with barriers, such as ditches, fences, down trees, and large rocks outside of the clear zone. Communication is a good first option before these measures are put in place. For example, a sign explaining native revegetation efforts may help make potential users aware that they should take their activities elsewhere. Local residents are often great sources for ideas on how to approach these problems; off-road vehicle clubs are another. Educating the public on the purpose for the revegetation treatments can go a long way toward protection. Short paragraphs in the local newspapers or on the FHWA website for each project may help. Using local contractors to implement the revegetation work and engaging local residents brings ownership to the project. In addition to exclusion measures, designers can consider desire paths to accommodate foot traffic that is bound to occur. Incorporating and planning for such access can reduce the impact to the surrounding established vegetation and keep traffic confined as much as possible.
Livestock
Damage to revegetation projects can be high in areas that are intensively grazed by cows or sheep. In areas with large livestock populations, planted tree seedlings can be injured by rubbing and trampling. Newly establishing native grass and forb cover can be harmed through grazing and by the high-pressure hoof marks tearing up the new roots and surface soil, leaving the site exposed to non-native annual species.
Restricting the entry of livestock for several years after planting or sowing, or until native grasses and forbs have established, is the best prevention measure. This is typically accomplished by fencing the entire area being revegetated. Fencing is most effective when it is installed prior to establishing native vegetation. For this reason, having the fence installed as part of the road contract will ensure that livestock is controlled prior to revegetation work. Working with the local USDA Forest Service or USDOI Bureau of Land Management range conservationist will be necessary to ensure that damage by livestock is kept to a minimum.
3.11.10 DESIGNING FOR CARBON SEQUESTRATION
Carbon sequestration is an important environmental and public health benefit that is a result of revegetating disturbed landscapes with native plants. It is often overlooked as a revegetation objective and as part of a vegetation management strategy. The “carbon sequestration capacity” is a quantifiable volume of carbon that can be estimated for existing roadside revegetation and compared to the proposed revegetation plan. Knowing the values in the planning stage can help the design team as they make decisions about design, implementation, and maintenance throughout the project development. Selection of plant material and the ongoing vegetation maintenance procedures have a dramatic effect on the carbon sequestration capacity of a revegetation project.
Carbon sequestration is a process in which CO2 is transferred from the atmosphere into plants through photosynthesis and stored in long-term carbon pools. These pools consist of above-ground biomass (e.g. live trees, shrubs, grasses, and standing dead trees, branches, litter, and duff) and below-grown biomass (e.g. soil organic matter, roots, organisms). Roadside management practices that maintain or increase these carbon pools may reduce atmospheric concentrations of CO2 and mitigate the effects of climate change (Proudfoot 2015). With the large land base of the US in roadsides, the current and potential capacity to capture CO2 is considerable (Ament 2014). For example, roadsides along US highways and federal lands (10.5 percent of all public roads) currently capture nearly 2 percent of the total US transportation carbon emission (Lavelle 2014). Another way that atmospheric carbon can be reduced is by decreasing or changing roadside maintenance operations that generate greenhouse gas emissions such as mowing and mechanized pesticide applications. In combination, practices that reduce carbon emission and increase carbon pools can reduce atmospheric carbon while reducing maintenance costs (Proudfoot 2015).
Minimizing Soil Disturbance
Soils contain large amounts of carbon fixed in soil organic matter. When soils are disturbed, CO2 is released through the oxidation of organic matter. One of the best strategies for maintaining carbon in soils is to minimize soil disturbances. In planning road construction projects, this is accomplished by minimizing the footprint of the project. Another strategy is to create and maintain a resilient plant community that resists disturbances associated with soil erosion and landslides. When disturbances do occur, immediate action assures the quick recovery of native plants and carbon sequestration processes (Section 3.11.10, see Create a Good Growing Environment).
Revegetating with Trees and Shrubs
Establishing and maintaining trees and shrubs along roadsides can be a cost-effective means of capturing carbon (Brown 2010). Compared to other vegetation, trees sequester larger amounts of carbon for longer periods of time (an average of 120 years, FHWA 2010). Trees also shade ground surfaces, reducing the amount of heat generated from roadsides. Shrubs have less capacity to store carbon than trees but greater capacity than grasslands (Ament 2014).
There is an opportunity to use vegetative plantings to create or replace wind breaks, shelterbelts, and snow fences (see Inset 3-3). Using trees and shrubs for these purposes will not only reduce blowing and drifting snow, but can increase wildlife diversity, pollinator habitat, and capture carbon. Using a thick vegetative barrier composed of shrub species near the roadway may also have the added benefit of slowing out-of-control vehicles from roadsides impacts (Ament 2014).
It is important that trees and shrubs are planted in areas that meet road safety and maintenance objectives. When choosing tree and shrub species to plant, species that live longer and are larger at maturity have a greater capacity to store carbon than shorter lived, smaller plants (Proudfoot 2015). In addition, increasing the complexity of a forested site, by planting a multilayer of trees, shrubs, grasses and forbs, has the potential of increasing carbon sequestration (Ament 2014).
Revegetate with Perennial Grass, Forb, and Wetland Species
Perennial grasses store more carbon in the soil than annual grasses (Cox et al 2006) and can sequester carbon for up to 50 years (FHWA 2010). In addition, perennial grasses have greater ground cover than annual grasses which protect soils from surface erosion, water loss, and nutrient loss (Glover 2005), important for optimizing carbon capture. Wetland species capture more carbon than grasses and forbs because of the higher productivity of wetland sites. For this reason, wetland swales are preferable to dry swales (Bouchard 2013).
Create and Maintain a Good Growing Environment
Revegetation planning that promotes healthy functioning plant communities is good for carbon capture and maintenance (Ament 2014). Restoring soils with organic amendments, tillage, mulch, and nutrients will increase the rooting depth and productivity of roadsides to store more carbon. Other practices that maximize slope stability and minimize surface runoff reduce the potential that soils are disturbed which maintains soil carbon. Where road sections are being abandoned or recontoured, restoring the soils and reestablishing perennial vegetation, such as shrubs and trees, have the potential to capture and store carbon while increasing pollinator habitat.
Utilize Site Resources
Land clearing during road construction often creates woody material that is placed in piles and burned. This material can be processed and placed on constructed roadsides as a soil amendment or mulch. Unprocessed woody material, such as logs, can be used as wildlife structures in areas where they meet maintenance objectives. Depending on site factors, processed and unprocessed materials can last from years to decades, temporarily storing carbon before they decompose. How salvaged topsoil is removed and stored may also make a difference in how much soil carbon is oxidized during road construction. Removing topsoil when it is dry and keeping it dry during storage reduces the potential for oxidation of organic matter.
Changing Mowing and Pesticide Practices
Changes in mowing and pesticide practices can directly reduce carbon emissions and increase carbon storage (Dunn 2013). A review of maintenance practices, when developing a vegetation maintenance strategy (Section 3.11) and an Integrated Vegetation Management plan (Chapter 7), can highlight areas where changes can be made. In addition to decreasing carbon emissions, changes to practices can also lower maintenance costs because of reduction in fuel and wages, and can be beneficial to pollinators (Section 7.3.2). Maintenance practices that can be adapted to reduce emissions and increase carbon capture include:
- Mowing times—Shifting mowing times from active growing periods (when mowing disrupts the flow of carbon to the soil) to times of the year when plants are more dormant (early spring, fall, and winter), will increase carbon capture (Dunn 2013).
- Frequency of application—Cutting back on the frequency of mowing or pesticide applications reduces carbon emissions.
- Height of mowing equipment—Raising mowing equipment several inches higher can save fuel costs and reduce the effects of carbon flow to the soil.
- Treatment widths—Reducing the widths of mowing and pesticide applications reduces travel time, amount of pesticide used, and carbon emissions.
Reducing Road Salts
On road systems where applications of deicing salts are detrimental to roadside vegetation (Section 3.11.9, see Deicing for Winter Safety), minimizing the quantity of salt applied or the frequency of application, can reduce the effects on plant productivity and carbon sequestration (Ament 2014). These changes will also result in less carbon emission.
Highway Carbon Sequestration Estimators
Numerous highway carbon sequestration estimators can help calculate the quantity of carbon being captured on a roadside and estimate the potential volume of carbon offsets. These tools do not necessarily provide estimates required for full project development and can only to provide a sense of scale (Proudfoot 2015). One such program is the Highway Carbon Sequestration Estimator. This tool is intended to help DOTs assess the return on investments for carbon sequestration practices based on state-specific considerations (FHWA 2010).
Back to top
3.12 SELECT SITE IMPROVEMENT TREATMENTS
In this stage of planning, the treatments that will improve the site for plant growth (e.g. topsoil, compost) are selected. The selection of treatments begins with identifying the factors that limit plant growth. As the designer identifies limitations specific to the project site, a list of possible treatments that will mitigate or reduce the effects of the limiting factor is developed. Specific treatments to mitigate each limiting factor are presented in Section 3.8. The case study presented in Inset 3-6 shows how a list of mitigating measures can be developed for specific limiting factors.
In narrowing down the possible treatments that will encourage plant success, the designer considers all possible resources on the project site that can be used in lieu of purchasing and transporting materials from offsite sources (Section 3.10). For example, in reviewing the plans of a road reconstruction project, it is found that a portion of the road is being realigned through a wooded area. For this section, the designer lists the potential site resources to include topsoil, large wood, tree branches and foliage, duff and litter. These resources can be used in a variety of ways to improve growing conditions and pollinator habitat.
At this point, the vegetation management strategy is revisited to ensure that the mitigating measures being considered in this process are compatible with road maintenance objectives (Section 3.11.2) or if they could present problems for long-term maintenance and if so, what modifications to the treatments can be made. The final selection of treatments is based on many factors, including project funding, project objectives, experience of the designer or contractor, and availability of resources and equipment. A Limiting Factor and Site Resource tables are available in this Planning workbook.
Inset 3-7 | Case Study—Defining limiting factors and selecting mitigating measures vegetation treatment zones
Site Inventory—During the planning stage of a revegetation project in central Oregon, the soils assessment (Section 3.6.2) highlighted several limiting factors that would negatively affect plant growth.
Limiting Factors—From the list of limiting factors outlined in Figure 3-11, factors affecting plant growth at this site were narrowed down to low precipitation, low water storage, high water loss, and low nutrients.
Mitigating Measures—For each of these factors, a list of possible mitigating measures (described for each limiting factor in Section 3.8) was developed.
Site Resources—A review of the site resources was made at this point to determine if there were any resources on the site that could be used in developing mitigating measures (Section 3.10). It was found that there were several areas where weed-free, high quality topsoil could be salvaged and reapplied. In addition, the project would produce a large amount of slash from cleared shrubs and trees that could be processed into shredded wood and used as a mulch. Other resources available were a local municipal waste treatment plant had Class A biosolids available for application in lieu of bringing in fertilizer, loam borrow from a source of pumice deposit, and an excavator that would be available for subsoiling.
Maintenance—The potential effects of these treatments on long-term maintenance was then considered (Section 3.11). It was determined that deep tillage was not compatible with safety in Zones 1 and 2 but would be done in Zone 3, otherwise there were no foreseen maintenance problems.
Treatment Selection—It was decided to salvage topsoil; however, the amount of topsoil would not cover all the project needs. It was determined that a manufactured topsoil would be created by using shredded wood processed the slash from road right-of-way clearing, loam borrow from excavated pumice, and biosolids from the local municipal waste treatment plant. To increase infiltration and rooting depth, it was decided that once the topsoil and manufactured topsoil was applied that it would be subsoiled only in subsoil Zone 3 but not in Zones 1 and 2. At planting, lupine would be included in the seed mix for additional nitrogen and inoculum would be applied to the seed mix. Because there would be additional shredded wood, it would be blown over the seed as a mulch.
| Critical plant factors |
Parameters |
Limiting |
Possible mitigating measures |
| Water input |
Precipitation |
? |
Irrigate, water harvesting |
| Interception |
|
|
| Infiltration |
? |
Tillage, organic matter, mulch, avoid compaction |
| Water storage and accessibility |
Soil texture |
? |
Organic matter |
| Rock fragments |
|
|
| Soil structure |
? |
Tillage, organic matter, avoid compaction |
| Rooting depth |
? |
Tillage, topsoil, planting islands/pockets |
| Mycorrhizal fungi |
? |
Topsoil, inoculums |
| Water loss |
Wind |
|
|
| Aspect |
|
|
| Competing vegetation |
|
|
| Soil cover |
? |
Mulch |
| Nutrient cycling |
Topsoil |
? |
Topsoil, planting islands |
| Site organic matter |
? |
Shredded wood, compost, litter, wood |
| Nitrogen and carbon |
? |
Topsoil, compost, N-fixing plants, fertilizers |
| Nutrients |
? |
Topsoil, compost, fertilizers, biosolids |
| pH and salts |
|
|
| Surface stability |
Rainfall |
|
|
| Wind |
|
|
| Freeze/Thaw |
? |
Tillage, mulch |
| Soil cover |
|
|
| Surface strength |
|
|
| Infiltration |
|
|
| Slope gradient |
|
|
| Surface roughness |
|
|
| Slope length |
|
|
| Slope stability |
Permeability |
|
|
| Restrictive layer |
|
|
| Water input |
|
|
| Slope length |
|
|
| Slope gradient |
|
|
| Soil strength |
|
|
Back to top
3.13 SELECTING PLANT SPECIES FOR PROPAGATION
From the comprehensive species spreadsheet developed in Section 3.6.1, each species is evaluated for its potential to be used on the project. This is accomplished by sorting the spreadsheet using some or all of the following criteria:
- Nativity—If the revegetation objectives call for using native plants, then species on the comprehensive species list are first sorted by whether it is native or not.
- Pollinator-friendly—Based on the pollinator habitat assessment (Section 3.6.3, see Habitat Assessment), a list of pollinator plant species to enhance site quality for pollinators can be developed from the ERA tool and the reference site plant species inventory.
- Workhorse species—The next sort is by workhorse species. Workhorse species is a term used to describe locally adapted native plants that: (1) have broad ecological amplitude, (2) high abundance, and (3) are relatively easy to propagate. A list of workhorse species for ecoregions (Level III) can be obtained using the ERA tool. Because these lists are still in development, some species may need to be evaluated for potential as a workhorse species based on the project objectives and needs. To determine if a species (not listed as a workhorse in ERA) is a potential workhorse species, sort the comprehensive species list by amplitude and abundance columns. Those species that have high amplitude and abundance are good candidates for workhorse species status. From these species, evaluate how easy they are to propagate. This includes the availability of the starter plant materials, how easy the species is to propagate in the nursery or seed production fields, how well the seeds store, the survival of the plant materials once they are installed on the project, and expense.
- Availability of starter plant materials—Seeds, plants, and cuttings often have to be collected in the wild and supplied to the nursery or seed producer for plant production, seed increase, or stooling beds. Species that are difficult to obtain or collect are not good candidates for workhorse species status (Section 5.3.1 through Section 5.3.3).
- Nursery and seed production—Species that are difficult to propagate in the nursery, stooling beds, or seed production fields do not make good workhorse species (Section 5.3.4 through Section 5.3.6). Because new techniques in propagating native species is constantly improving, talking to nursery managers or seed growers, in addition to referring to documented plant production protocols available on the internet, is important in maintaining a current workhorse species list.
- Longevity—Seeds that have a poor shelf life under seed standard storage practices (seed germination that drops significantly after one year in storage) are often not good candidates (Section 5.3.4).
- Field establishment—The ease that a plant material will establish on a project site will determine if a species is a workhorse species (Section 5.3.3 and Section 5.5). Some species do not perform well because breaking seed dormancy and obtaining good germination may be difficult. Other species, planted as seedlings, experience unusually high transplant shock that significantly reduces plant survival.
- Expense—The total costs for establishing native plants on the project site is the easiest measure of whether a species is a good candidate for workhorse species status.
- Working groups—A working group is a mix of workhorse species developed for a specific ecological function or management objective. One of the best ways to develop working groups is to sort the comprehensive species list by ecological setting and succession. This will assemble species into groups that naturally occur together. From these groups, working groups are developed based on project objectives, such as pollinator habitat enhancement, weed control, visual enhancement, conservation management, and erosion control (Figure 3-93). The development of these working groups is often the basis for a project’s seed mixes and planting mixes for each revegetation unit.
- Specialist species—Species that are important for achieving project objectives yet do not meet the workhorse species criteria for seed propagation are called specialist species (Figure 3-94). These species may still be propagated; however, because there may be very little information about seed propagation, they may take more time and higher costs to develop. Projects that contain special microclimates or soils may require a unique mix of specialist species (e.g., a wetland working group), while other projects may require a specific species to meet a project objective (e.g., milkweed as host plant for monarch butterfly). If only a small quantity of specialist species is needed, then consider using methods other than seed propagation. These include collecting plant materials in the wild or growing seedlings in the nursery.
Once the spreadsheet is complete, the species and stocktypes to propagate can be selected.
Table 3-14 | Example of a form for collecting topsoil information
The comprehensive species list developed in Table 3-6 can be used to determine the species that are most appropriate to use on the project. In this example, non-native species were removed from the list, leaving only native species. Then potential workhorse species were determined by their amplitude, abundance, and ease of propagation. A species such as Achillea millefolium, for instance, is considered a workhorse species because it fits all criteria—high abundance, high amplitude, and easy to propagate. Whether this species is used for this project depends on whether it is a member of a particular working group that meets a specific project objective. Because Achillea millefolium fits into the “visuals” working group, which is an important road objective, this species is selected for propagation. Agastache urticifolia is also showy and has a high amplitude and abundance. However, very little is known about the propagation of this species. While this species has the potential of being a workhorse species, it will be grown as a trial in small quantities. Allium fibrillum and Allium macrum are specialist species that occur together in a unique meadow habitat. Because this road project provides an opportunity to enhance meadow habitat, these two species are placed in a “conservation” working group. They are considered specialists because they have low abundance, low amplitude, and little is known about their propagation, yet they are an important component of the working group. These species will be selected for use on the project; however, because little is known about seed propagation, seeds will be sent to a nursery for plant or bulb propagation.
|
Achillea millefolium
|
common yarrow
|
High
|
High
|
Early
|
All
|
Seeds
|
Easy
|
Yes
|
Visuals
|
|
Yes
|
|
Agastache urticifolia
|
horsemint
|
High
|
High
|
Early
|
All
|
Seeds
|
Unknown
|
No
|
Visuals
|
|
Trials
|
|
Agoseris aurantiaca
|
orange agoseris
|
High
|
Mod
|
Early
|
All
|
Seeds
|
Unknown
|
No
|
|
|
|
|
Agoseris glauca
|
pale agoseris
|
High
|
Mod
|
Early
|
All
|
Seeds
|
Unknown
|
No
|
|
|
|
|
Agoseris grandiflora
|
bigflower agoseris
|
High
|
Mod
|
Early
|
All
|
Seeds
|
Unknown
|
No
|
|
|
|
|
Abies grandis
|
grand fir
|
High
|
High
|
Late
|
All
|
Plants
|
Easy
|
Yes
|
|
|
Yes
|
|
Abies lasiocarpa
|
subalpine fir
|
High
|
Mod
|
Late
|
Cool
|
Plants
|
Difficult
|
No
|
|
|
|
|
Allium acuminatum
|
tapertip onion
|
Low
|
Low
|
Early
|
Wet
|
Bulbs
|
Difficult
|
No
|
|
|
|
|
Allium fibriatum
|
fringed onion
|
Low
|
Low
|
Early
|
Warm/Dry
|
Bulbs
|
Difficult
|
No
|
Conservation
|
Yes
|
Yes
|
|
Allium macrum
|
rock onion
|
Low
|
Low
|
Early
|
Wet
|
Bulbs
|
Difficult
|
No
|
Conservation
|
Yes
|
Yes
|
|
Allium madidum
|
swamp onion
|
Low
|
Mod
|
Early
|
Wet
|
Bulbs
|
Difficult
|
No
|
|
|
|
3.13.2 ENSURE LOCAL ADAPTATION AND MAINTAIN GENETIC DIVERSITY
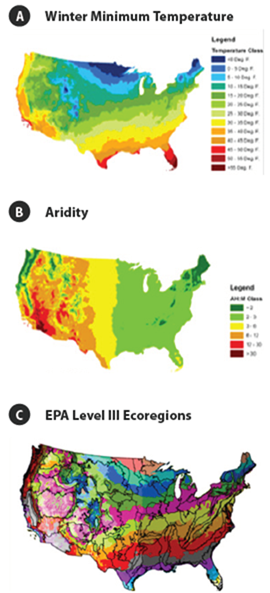 Figure 3-95 | Provisional seed zones
 - Provisional seed zones for native plants are unique climatically delineated areas (A and B) nested within EPA Level III Ecoregion boundaries (C). The provisional zones can be used to guide seed sourcing decisions when species-specific genetic information is lacking (Bowers et al 2014).
Seed Zones and Transfer Guidelines
It is important to know the original collection source and genetic background of target plant materials to ensure better long-term adaptation to local conditions and protect plant-pollinator relationships and the genetic resources of local plant communities. Seed transfer guidelines (how far plant material can be transferred from point of origin to the project with minimal risk of maladaptation) were initially developed for commercially important forest tree species. This was the outcome of years of research that revealed that failures in tree planting establishment were sometimes the result of moving seeds too far from their source of origin. More recently, research has been completed or is under way to develop seed zones and transfer guidelines for grasses, forbs, and shrub species commonly used in revegetation activities, particularly in the western U.S. (e.g., Table 1 in Bower et al 2014; St. Clair et al 2013; Johnson et al 2013; Horning 2010).
Seed sources that originate within the specific seed zone where a planting site is located are likely to be well adapted, with improved survival, reproductive success, and resiliency in harsh sites and changing climate conditions. Genetic research indicates there is no fixed number determining the geographic distance that plants might be successfully moved (e.g., within a 50-mile radius). Rather, “local” is best defined in terms of the environment (local climate and soils) rather than absolute distance. Many factors contribute to the environmental conditions to which a plant species must adapt, including rainfall, aridity, maximum and minimum temperatures, aspect, soil drainage, and pH. The scale of adaptation also varies greatly among species. Some species (genetic generalists) can tolerate broader movement across environmental gradients than others (genetic specialists) and still be well adapted to local conditions and regions (Rehfeldt 1994; Johnson et al 2010). Thus, plant movement guidelines derived from empirical genetic studies are specific to the individual species and geographic area where the research was conducted.
In addition to improving the success of revegetation projects, seed zones can create efficiencies and economies of scale in commercial markets and seed banking programs and partner- ships (Erickson 2008). This will reduce the cost of native plant material production and use, as well as increase the availability of genetically appropriate plant materials. Despite the numerous benefits, genetic guidelines for plant material movement are lacking for many native grass, forb, and shrub species used in roadside revegetation and pollinator habitat enhancement activities. In these cases, generalized provisional seed zones (Figure 3-95) (Bower et al 2014) may be useful in guiding seed movement and sourcing plant materials. The generalized guidelines are based on climate data (winter minimum temperatures and aridity) and boundaries of the Environmental Protection Agency (EPA) Level III ecoregions (Section 3.3.3, see Ecoregions and Seed Zones) to delineate areas that are similar climatically yet differ ecologically. These provisional seed zones can be considered a starting point for guidelines for seed transfer and can be used in conjunction with appropriate species-specific information as well as local knowledge of microsite differences. Inset 3-7 and Inset 3-8 provide further details on the provisional seed zones, as well as other information and tools to assist designers in choosing appropriate plant materials for revegetation and pollinator plantings. Provisional seed zones have been incorporated into the ERA online tool discussed in Section 3.3.3 (see Ecoregional Revegetation Application (ERA)) as an independent map layer.
Genetic Variation
Another important issue in selecting native plant materials is maintaining genetic variation in the populations established in revegetation work. This is especially important to ensure resiliency in the context of a rapidly changing climate. Plant populations that are genetically variable can adapt and respond to changing stresses and climates. Collection and propagation procedures, as well as agronomic and nursery production methodologies, need to conserve sufficient genetic diversity to enhance revegetation success and buffer against environmental stresses and changes in both the short and long term (Section 5.3.1 and Section 5.3.4). Additionally, a sufficient number of unrelated seed parents can be included to ensure that inbreeding does not become a problem in the future. Both issues come down to numbers—the more plants that contribute to the new population, the more genetic variation will be captured and the lower the likelihood that relatives will mate (less inbreeding). A good practice is for managers to consider these criteria, whether they are buying plant materials or collecting their own. When procuring seed on the commercial market, designers can consider consulting with seed producers and distributors and other reputable sources, including government websites and published literature, to determine the most appropriate available plant materials for a project area. Factors to consider include seed source origins relative to the project site, plant development methodologies, and certification class. In many states, the newer native species releases are certified as “Source Identified, Pre-Varietal Releases”, which originate from natural stands, seed production areas, seed fields, or orchards where no selection or genetic manipulation of the parent population has been conducted. The Association of Official Seed Certifying Agencies (AOSCA) has published certification standards and guidelines for the certification of Pre-Varietal Germplasm releases, however not all state certifying agencies have adopted these plant release types within their respective state laws and regulations.
Inset 3-8 | Locally adapted plant materials
Choosing the right plant materials for a project is fundamental to revegetation success, both in the short and long term. With inappropriate seed mixes, projects may fail outright (e.g., low germination or high seedling mortality) or lead to more cryptic problems in the future, such as poor regeneration potential, phenological asynchrony with dependent pollinators, genetic degradation of surrounding plant communities, and loss of resiliency and adaptive capacity in responding to new stresses (e.g., invasive plant species or climate change).
A large number of studies have shown that locally derived and genetically diverse plant sources are likely to be best adapted to prevailing climatic and environmental conditions (Hufford and Mazer 2003; Savolainen et al 2007; Johnson et al 2010). This means that in addition to matching species assemblages to a project site, designers understand and consider the seed source origin and genetic diversity of available plant materials to be successful (McKay et al 2005; Crémieux et al 2010; Mijnsbruggea et al 2010; Schröder and Prasse 2013). Moreover, federal and state agencies are increasingly suggesting or requiring the use of locally adapted and regionally appropriate native plant materials in revegetation work based on site characteristics and ecological setting (see Appendix 1 in Johnson et al 2010).
Because restoration with native plants is still relatively new in the United States, the supporting research, infrastructure, and plant material development programs are in the early stages of development. Genetic guidelines for determining what is local are often lacking for many native species of interest (Erickson 2008; Johnson et al 2010). As a consequence, native plants of inappropriate or unknown origin are being sold and planted, including some that may originate well outside of the area targeted for planting.
Provisional Seed Zones
Seed zones help identify where plant materials originated and how far they can be moved. Empirical seed zones for individual species are developed through field trials in which a large number of seed sources from a wide range of source environments are evaluated for important adaptive traits, such as growth rate and vegetative and reproductive phenology. By relating measured traits to climate or other environmental variables, researchers are able to create maps and delineate areas (seed zones) that are relatively homogenous with respect to adaptive genetic variation. The seed zones represent areas within which seed and plant materials can be transferred with little risk of maladaptation or other adverse consequences (Campbell 1986; Sorensen 1992; Rehfeldt 1994; Erickson 2004; St. Clair et al 2005).
Generalized or “provisional” seed zones (Bower et al 2014) have been developed for the continental United States using minimum temperature and aridity variables in combination with EPA Level III Ecoregions (Omernik 1987). The resulting map (Figure 3-95) captures much of the variation existing in adaptive seed zones (Bower et al 2014; Kramer et al 2015). Therefore, the combined generalized or “provisional” seed zone and ecoregion mapping approach is a good starting place for species and geographic areas where empirical seed zones are unavailable.
In creating the provisional seed zones, temperature minimum values were grouped into 13 discrete classes that reflect the temperature bands used in the USDA plant hardiness zone map (USDA Agricultural Resource Service 2012). The hardiness map is familiar to designers and land managers and has been widely used for decades. An annual heat:moisture index (AH:M) was used as a measure of aridity to distinguish areas that are warm and wet (low-moderate aridity), cold and wet (low aridity), warm and dry (high aridity), and cold and dry (moderate-high aridity). Index values were divided into six discrete classes, with higher values indicating more arid environments. Intersection of the minimum winter temperature with the AH:M layer created unique climatically delineated (temperature-aridity) zones. In the final map, EPA Level III Ecoregions were overlaid on climate zones to identify areas that differ ecologically although they may be similar climatically (Figure 3-95).
The provisional seed zones, along with empirical seed zones for some native plants, are available online in the Seed Zone Mapper application. Provisional seed zones have also been incorporated into the ERA online tool, discussed in Section 3.3.3 (see Ecoregional Revegetation Application (ERA)), as an independent map layer.
Inset 3-9 | What to do if there are no locally adapted native see sources available
Adapted from Erickson et al 2003; Aubry et al 2005
The volume of seeds needed for a revegetation project may not always be available in sufficient quantities, particularly when plans have changed or the revegetation specialist has not been involved until the latter stages of the project. In these instances, three choices are available to the revegetation specialist:
- wait several years until the appropriate seeds are available;
- use introduced species that are non-persistent, non-invasive, or sterile, or
- use non-native cultivars or non-local native cultivars.
Defer Seeding
If the appropriate species or seed sources are not available, then consider not seeding until the appropriate seeds become available. In the interim, consider using soil cover for erosion control.
Introduced Species
When appropriate seed sources are unavailable, sterile hybrids or annual/biennial/perennial introduced plant species that are non-persistent and non-invasive may be considered. Preferred non-native species are those that will not aggressively compete with the naturally occurring native plant community, invade plant communities outside the project area, persist in the ecosystem over the long term, or exchange genetic material with local native plant species. Some of these species include sterile hybrids, such as Regreen (a wheat x wheatgrass sterile hybrid) and annuals such as common oat (Avena sativa) and common wheat (Triticum aestivum). Consider avoiding exotic species that have not already been introduced into the area, or that have been found to be aggressive and/or persistent. Also, consider avoiding non-native species that were commonly used in the past, such as Kentucky bluegrass (Poa pratensis), smooth brome (Bromus inermis), crested wheatgrass (Agropyron cristatum), orchardgrass (Dactylis glomerata), yellow and white sweetclover (Melilotus officinalis and M. albus), alsike clover (Trifolium hybridum), and alfalfa (Medicago sativa), among others. These species are generally no longer recommended due to their highly aggressive nature, resulting in widespread displacement of native species and plant communities that are low in diversity and poor pollinator habitat
Non-Local Native Species
Native species that do not occur naturally in the local ecosystem, or native plant material that does not originate from genetically local sources, may be considered. These types of plant materials may include commercial cultivars. A cultivar is “a distinct, often intentionally bred subset of a species that will behave uniformly and predictably when grown in an environment to which it is adapted” (Aubry et al 2005). These cultivars are generally not preferable for wildland use due to concerns over adaptability, genetic diversity level, and the potential for genetic contamination, or “swamping,” of local native gene pools, including those of threatened, endangered, and sensitive plants (Millar and Libby 1989; Knapp and Rice 1994; Linhart 1995; Montalvo et al 1997; Lesica and Allendorf 1999; Hufford and Mazer 2003). Because commercial cultivars are typically selected for agronomic traits, such as high fecundity, vegetative vigor, and competitive ability, their use may also adversely impact resident plant populations through direct competition and displacement. Cultivars bred for traits such as showiness may have little value to pollinators due to low pollen and nectar production. Plant-pollinator relationships could be disrupted if the growth and reproductive cycle of non-locally sourced plants is different or out of sync with pollinator needs (Norcini et al 2001; Houseal and Smith 2000; Gustafson et al 2005). This is especially a concern with specialist pollinators that are reliant on the nectar and pollen from a small subset of plant species and synchronize their annual emergence to the flowering time of their host plants. Cultivars of native species (and introduced look-alikes such as sheep fescue [Festuca ovina]) can also be problematic if they are difficult to distinguish from native germplasm. This could severely complicate efforts to collect and propagate local material and waste valuable economic resources.
Because of these numerous concerns, consider using cultivars sparingly or not at all, with project objectives clearly understood. Consult with the seed producer or distributor before buying seeds and ask for the most appropriate cultivar for the project area, where the source for the cultivar was collected (geographic location and elevation), and how many collections were made. The seeds will likely be certified with a certification tag attached to each seed bag. Consider obtaining tests for seed germination, purity, noxious weeds, and seeds per pound.
Failing to consider genetic variation when selecting plant materials could have significant consequences on the viability and sustainability of revegetation efforts. Yet it is easy to imagine how variability can be eroded. If plants are propagated from a very small and inadequate sampling of the population, genetic variation of the propagated plants will be greatly reduced.
Reproductive strategies vary widely among species. No single collection and propagation protocol will ensure the genetic integrity of all types of plants used in revegetation. However, the issue of genetic variation cannot be ignored. Consider accounting for the following when purchasing or collecting native plant materials:
- Number of related individuals—Identifying which plants in a population are likely to be related can be difficult without expensive genetic analyses, but there are ways to minimize the collection of related individuals. In general, avoid collecting plants growing very close to each other to minimize the risk of collecting siblings or even clones of the same plant (Vekemans and Hardy 2004; Rhodes et al 2014). It is recommended to collect plants growing throughout the whole site to ensure that the full diversity of the site is captured, especially plants growing along the edges of each population.
- Number of parents—Collecting seed or cuttings from a minimum of 50 unrelated parent plants will help ensure that most of the genetic variation in a population is captured. Additional plant material would be needed if contribution by parents (of seeds or cuttings) is unequal. For dioecious species, attention to male-female ratios is essential to ensure adequate representation of both sexes.
- Source sites (stands)—To represent the population of a seed zone well, consider collecting seeds or cuttings from multiple sites within the zone. Considering sampling a similar number of parents from each site. Seek out larger communities to help meet parent selection criteria.
- Individual parents within a selected source—Individual maternal parents (seed plants) are to be well separated from each other yet not isolated from other plants of the same species. This will allow cross pollination by numerous paternal parents, adding to diversity. A similar amount of seeds are to be collected from each parent. Collecting from plants throughout the entire site will also promote sampling the full range of diversity that is present.
Section 5.11, Obtaining Plant Materials provides additional guidance on ensuring genetic diversity when collecting seed and cuttings. Guidelines have also been developed to help designers work with seed producers and nurseries that follow practices for maintaining high genetic variability throughout the native plant material production process (e.g., Basey et al 2015).
Back to top
3.19 SELECT PLANT ESTABLISHMENT METHODS
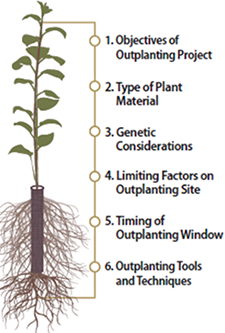 Figure 3-96 | The Target Plant Concept
 - The Target Plant Concept identifies six requirements for establishing native plants. Adapted from Landis 2009
After compiling a list of species and genetic sources to use for revegetation, the next steps are to determine the optimal propagation methods for each species and to identify the most appropriate plant material sources for a particular site or revegetation objective.
A useful tool for selecting the plant materials best suited to the project is the Target Plant Concept (Landis 2009). The Target Plant Concept (Figure 3-96) is an integrated sequential process for evaluating plant material requirements within the context of project objectives and site characteristics that may influence the suitability of seed sources or stocktypes, as well as the timing and optimal method of out-planting. The concept is based on the premise that there is no such thing as an “ideal” all-purpose seed mix, genetic source, or stocktype that will always work in any situation. Instead, the fitness of the plant material is determined by its appropriateness to the site in which it will be out-planted. Because every site is unique, seed mix and sourcing decisions can be tailored to each site or project to the extent possible. Otherwise, time and investments in site preparation, plant propagation, and outplanting may be wasted.
At this phase in the overall planning process, two of the steps in the Target Plant Concept have previously been covered: the objectives for establishing vegetation (Section 3.2) and the factors that possibly play the largest role in limiting plant survival and growth on each revegetation unit (Section 3.8)The remaining target plant requirements to consider are as follows:
- Type of plant material to be used (seeds, cuttings, containerized or bareroot seedlings, or salvaged plants)
- Methods to be used to install plant materials and what post-installation plant care is appropriate
- Proper season for outplanting or seeding (the outplanting or seeding window)
Once species have been selected and genetically appropriate sources of plant materials have been identified, the next step is to determine the most appropriate plant materials for the project. Revegetating with native plants commonly involves multiple methods to reestablish vegetation on the project site. The following are possible considerations:
- Maximizing natural regeneration/recovery
- Salvage existing plants
- Direct seeding
- Outplanting nursery stock
3.14.1 SELECTING PLANT MATERIALS
In areas with relatively good soil stability that are bordered by healthy populations of viable native species, the existing seed bank and natural regeneration processes are key parts of re-establishing native vegetation on road sites. Minimizing the road footprint and damage from road construction are important aspects of any type of planning but are especially key if revegetation tactics involve supporting natural regeneration over more intensive revegetation interventions. In these cases, as long as topsoil is saved, the disturbance from road construction might serve to scarify the native seed bank. Often the option of maximizing natural regeneration is not sufficient to fully revegetate a roadside environment; nevertheless, consider always anticipating the possibility. Salvaging and reapplying duff and litter layers to disturbed surfaces can aid in maximizing natural regeneration. The revegetation plan can acknowledge aspects of the revegetation process that are expected to develop naturally (Clewell et al, 2005).
However, if native seed regeneration is not sufficient to revegetate the site, additional plant materials will need to be obtained and established. Plant materials may include the following:
Determining which plant material to select for revegetation depends on the type of species being grown. For example, conifer trees have been shown to establish better and faster from plants than from seed or cuttings. Alternatively, grasses can be established from plants, but growing grass plants and planting them is very expensive compared to using seeds. Some species, however, do not produce reliable crops of seeds and therefore other plant materials, such as cuttings, will have to be used. Table 3-15 and Table 3-16 compare the advantages and disadvantages of different establishment methods and stocktypes. Various implementation guides provided in Chapter 5 describe in more detail the process for obtaining plant materials.
Seeds
Seeds are collected in the wild from native stands of grasses, forbs, shrubs, trees, and wetland plants. This plant material is used for seeding projects, such as hydroseeding of cut and fill slopes or other large areas of bare soil. Seeds of grass and forb species are best used for direct sowing, whereas seeds of shrubs and tree species are best used to grow nursery plants. If large amounts of grass or forb seeds are required for a project, seed collections can be increased through seed increase contracts. It can take up to three years to obtain enough seeds for a revegetation project—one year to collect the wild seeds and one to two years for seed increase. One of the advantages of direct seeding is that it can be an inexpensive method of reestablishing plants for a large area. Guides to collecting wild seeds, increasing seeds, and salvaging topsoil, duff, and litter are provided in Chapter 5.
Cuttings
Cuttings are taken from stems, roots, or other plant parts and directly planted on the project site or grown into rooted cuttings at a nursery for later outplanting. Only a few species, such as willow (Salix spp.) and cottonwood (Populusspp.), can be easily established from direct sticking of cuttings on a project site. Other species, such as quaking aspen (Populus tremuloides), can be established from cuttings in a controlled nursery environment but not in the field. Propagating plants from cuttings of most species is not possible under most growing conditions. Cuttings are collected in the wild in the winter and either stored or immediately planted on the project site. If large quantities of cuttings are required, they can be propagated by growing them in stooling beds for several years at a nursery or other growing facility. Guides to working with cuttings are presented in Section 5.3 and Section 5.4.
Plants
Trees and shrubs are typically established using nursery stock rather than by direct seeding for several reasons. First, obtaining seeds from most tree and shrub species is expensive; in many years, they can be difficult to find or collect. Second, shrub and tree seeds germinate and grow into seedlings at a slower rate than grass and forb species, giving them a disadvantage on the sites where grasses and forbs are present. Starting shrubs and conifers from large plants instead of seeds gives them a competitive advantage over grasses and forbs because roots are often longer and better developed, allowing access to deeper soil moisture. Grass and forb species are seldom established from nursery-grown plants because of the high cost. Exceptions are when grass or forb seeds are rare or difficult to collect or increase (often referred to as “recalcitrant” species); if species are difficult to establish from seeds on disturbed sites; or when the project requires restoring threatened or sensitive species that are typically not considered workhorse species.
Plants are typically grown in a nursery or agricultural setting. However, for some projects, plants are salvaged from the construction site or adjacent areas. Sometimes salvaged plants are simply relocated quickly from one area to another. At other times, they may be transplanted into a nursery and replanted at a later time. Plants that are grown in a nursery need a lead time of one to two years from the time of ordering to availability. A variety of stocktypes are available from nurseries, including small to very large plants—plants in containers or those without soil around the roots (bareroot)—and plants grown in greenhouse environments or field-grown plants (Table 3-15). Selecting a stocktype will depend on the needs of the project, as there are multiple options for propagation and establishment, as well as many stocktypes to choose from.
Table 3-15 | Comparison of plant material types for revegetation planning
| Type |
Advantages |
Disadvantages |
|
Balled-in-burlap
The plant is grown in the field, dug up with its roots and surrounding soil, and wrapped in a protective material such as burlap.
|
Well-developed root systems increase chances of survival on site
|
Expensive
|
|
Provide shade and earlier establishment of upper canopy on site
|
Large and heavy to transport
|
|
Bare-root
The plant is sold without any soil around its roots.
|
Less expensive. Easier to transport to site; lightweight to carry around for planting
|
Requires care not to let root systems dry out before planting. Difficult to establish in dry sites or sites with warm, sunny spring seasons.
|
|
Roots have not been restricted by containers
|
|
|
Container
The plant is sold in a container of potting media or soil with drainage holes. Sizes and shapes or containers range from very small to very large.
|
Well-established root systems with intact soil
|
Native soil not used in nursery; transplant shock may occur when roots try to move into native soil
|
|
Provide “instant” plants on site
|
Can be expensive
|
|
Available in a variety of sizes; many are available year-round
|
Can be difficult to transport to and around site if large numbers are used
|
|
Can be planted all year long
|
Can be difficult to provide irrigation until established; may actually require more maintenance than plug
|
|
Liners/Plugs
A small plant, rooted cutting, or seedling that is ready for transplanting. They are often used for herbaceous plants and grasses.
|
Well-established root systems with intact soil.
|
Same as above
|
|
Easy to transplant; plant material pops out of containers easily
|
Smaller plants may take longer to establish; may require more initial maintenance
|
|
Cuttings
A piece of branch, root, or leaf that is separated from a host plant and used to create a new plant. These may be placed in a rooting medium or stuck directly into the ground for planting.
|
Inexpensive to produce; cutting may easily be taken on site or from nearby site
|
No established root systems
|
|
Easy and light to transport; known to work well in rocky areas or areas difficult to access
|
Timing of taking cuttings and planting them is important; varies among species and limited to dormant periods
|
|
Salvage
Native plants that are removed from a site (to a nursery, storage area, or directly to another field location) before ground disturbance at that site occurs. (Can also refer to salvaged cuttings or seed sources.)
|
Can use plant material that would otherwise be destroyed
|
Different native plants respond differently to being dug up; some loss could be expected
|
|
Plant material could be local to site
|
Requires fairly intensive measures to protect plants and ensure they have adequate irrigation
|
| Relatively inexpensive |
|
|
Small or young salvage plants often adapt more readily to transplant than do mature specimens
|
|
Adapted from Dorner 2002
Potential disease and insect issues
For the Designer
Consult pathologists at extension offices, universities, or other agencies for expert input on disease issues.
Diseases can affect all native plant species used in revegetation, but assessing and mitigating for individual diseases is at times overlooked during revegetation projects. If a disease occurs, many times it is the result of trying to establish plant species in the wrong environment. For instance, species adapted to dry environments may be susceptible to certain diseases if planted in wet soils where a different set of root and other pathogens are present. While pathogens might be present on a site, this does not necessarily mean that plants will be af- fected. Much like humans, plants are always surrounded by a variety of pathogens, but it is not until they experience stress that they become more susceptible to diseases.
For the Designer
To prevent disease spread to native populations, designers should consider only working with nurseries that have practices to ensure only disease-free nursery stock is out-planted.
Planting appropriate species matched to sites where they have adapted to, using genetically appropriate stock, purchasing high quality plant materials from nurseries with good disease and insect management practices, improving the soil, and mitigating for climate extremes all play an essential role in creating healthy plants capable of resisting diseases or insect pests. If diseases are found on seedlings after planting, they may have previously become infected at the nursery. Appropriate sanitation procedures and practices a nursery might employ to help mitigate the risk of diseases include using only clean containers and potting media, starting with disease-free stock, and using only clean (non-recycled water). For more information on nursery practices that help prevent the spread of diseases or insect pests, the designer can find example guidelines in the Native Revegetation Resource Library. There have been some cases when diseases originating in the nursery can spread to native plant populations with devastating effects. The recent spread of Phytophthora ramorum (the water mold pathogen that causes Sudden Oak Death, aka SOD) in California, Oregon and elsewhere serves as a dramatic example of the problems faced when pathogens are released into the landscape (www.calphytos.org). Avoiding the purchase of damaged and infested stock and purchasing from growers that use best management practices can greatly reduce the risk of spreading diseases or insects.
For the Designer
Designers should consider consulting entomologists at extension offices, universities, or other agencies for expert input on insect issues.
A variety of insects can damage newly planted seedlings, as discussed briefly in this section. Because this is a specialized field, the designer is advised to consult technical or academic experts if insect problems are extensive on a revegetation project. Insect damage is grouped into four classes (Helgerson et al 1992), based on where insect feeding occurs:
- Sap-suckers—foliage
- Root beetles—root system
- Terminal feeders—terminal shoots
- Secondary bark beetles—stems
It may be difficult during the planning stages to determine if insects will be a limiting factor. However, designers can consult with entomologists to determine which insects might be known species of concern. Damage to seedlings by insects may be often overlooked because the injury usually occurs before the seedling shows visible signs of stress. By this time, the insect is no longer present, leaving only signs of previous activity. When dead or dying seedlings are discovered, it is important to systematically evaluate the seedling from the root system to the terminal bud for the presence of insects, insect damage, and diseases (discussed in the following section). If insects are found, consider collecting individuals for later identification. Designers can place insects in small glass or plastic containers until they can be examined by an entomologist. It is important to look under the leaves for aphids and scrape the entire seedling with a sharp knife to observe boring and tunneling. Damage caused by insects and diseases can occur under the bark of the stems and roots themselves. A hand lens is helpful when evaluating damage. The following discusses some of the most prominent insects that damage conifer seedlings. Non-conifer species will have their own unique associated pests. Nevertheless, classifying the insect into one of the four classes is a start in making a diagnosis.
- Sap-Suckers—Sap-suckers include the Cooley spruce gall adelgid (Adelges cooleyi) and the giant conifer aphids (Cinara spp.) that feed on succulent foliage of tree seedlings. While these can cause shoot deformity and foliage loss, aphids will normally not kill seedlings. The appearance of aphid ants (which cultivate aphid populations) on the leaves are indications that aphids are present.
- Root Beetles—The root bark beetles (Hylastes spp.) and root-collar weevil (Steremnius carinatus) girdle the roots and stems of conifer seedlings and will weaken or kill newly planted seedlings. The damage can be mistaken for herbivory by small mammals, but the lack of teeth marks and the below-ground location of the damage are indications that the damage is caused by root beetles.
- Terminal Feeders—The larvae of this group of insects feed on the terminal shoots of young conifers, killing much of the new growth. Continued annual attack by these insects can severely stunt conifer seedlings. The major insects include white pine weevil (Pissodes strobi [Peck]), ponderosa pine tip moth (Rhyacionia zozana), western pine shoot borer (Eucosma sonomana), and the cone worm (Dioryctria spp.).
- Secondary Bark Beetles—The Douglas-fir engraver beetle (Scolytus unispinosus) attacks the stems of stressed seedlings, creating galleries under the bark that weaken or kill Douglas-fir seedlings.
Some examples of ways to mitigate for insects include:
- Plant a Variety of Species—Insects are often host-specific, meaning they attack only one species. For this reason, a preventative measure is to plant a variety of species. If an insect infestation occurs, it may not affect all the seedlings planted.
- Plant Healthy Stock—Insects often attack weakened seedlings or seedlings that are stressed. Planting only healthy and vigorous seedlings, appropriate to the site, reduces the potential damage by insects.
- Create a Healthy Soil Environment—Seedlings grown on poor sites, or on sites outside of the species’ environmental ranges, will be stressed and become susceptible to insect damage. Planting seedlings on optimal growing sites will produce healthy seedlings resistant to insect damage. Judicious use of fertilizers (that is, avoid over-fertilization) is also important for pest prevention. For example, sucking insects often attack plants that have been over-fertilized with nitrogen.
- Install Bud Caps—Some terminal feeders can be controlled through the use of bud caps that are placed over the terminal in the spring prior to shoot growth (Goheen 2005). Bud caps are materials made out of paper or fine cloth that temporarily cover the terminal and prevent adult insects from laying eggs on the bud.
For any stocktype, it is important to define various desired characteristics, including age, size, likelihood of survival on the site, ability to compete with other vegetation and/or tolerate animal effects, and methods that will be necessary to out-plant and maintain the stocktype. For bareroot stocktypes, consider size, age, and potential survival rates. For cuttings, consider if the project requires containerized cuttings (with a root system in a container), heeled or bareroot cuttings (with roots but no container), or simply cuttings to stick directly in the ground on the project site. For cuttings, length, caliper, and conditions of storage are also important factors. For container plants, no standard terminology exists for describing the different types of container plants available (Landis et al 1992). They are usually described by their container type, referring to the volume and usually the shape of the container. Size and age of the plant are also described. When ordering container plants, consider age, caliper, height, and root size and depth, as well as any other special characteristics that might help the plant survive on the project site (Table 3-15).
Salvaging plants from the project area can be an important component of protecting native plant diversity on the project site. Sometimes salvaged plants are simply relocated instantly from one area to another. Other times, they may be transplanted or moved to a nursery area, cared for, and then re-planted at an appropriate time. As much native soil as possible is included when digging the salvaged plants, as this soil not only supports the health of the plants but also contains the native seedbank and root fragments of it and adjacent plants. “Salvage” may also involve harvesting cuttings or seeds from plants that are going to be removed during the road construction process.
Depending on the species, genetics, site limiting factors, and specific project objectives, some concept of the appropriate “target” stocktypes will already be defined. For example, some plants respond well to certain propagation methods; some will be salvaged (“wildings”) from the site; and some are obvious candidates for direct seedling applications in order to facilitate fast regeneration. The needs and characteristics of a particular species will help determine if direct seeding, nursery propagation, or other methods are the more appropriate strategy. Many options can be considered, some of which are summarized in Table 3-16.
Table 3-16 | Comparison of different plant establishment methods
|
Characteristic
|
Wild
|
Cuttings
|
Seeds
|
Nursery plants
|
|
Efficient use of seeds and cuttings
|
N/A
|
No
|
No
|
Yes
|
|
Cost of establishment
|
High
|
Moderate
|
Low
|
Moderate
|
|
Ability to establish difficult species
|
Yes
|
No
|
No
|
Yes
|
|
Option of using specific genotypes
|
No
|
No
|
Yes
|
Yes
|
|
Precise scheduling of plant establishment
|
Yes
|
Yes
|
No
|
Yes
|
|
Control of stand composition and density
|
Yes
|
Yes
|
No
|
Yes
|
|
Matching stocktypes to site conditions
|
No
|
No
|
No
|
Yes
|
|
Depletion of adjacent plant stands
|
Yes
|
Yes
|
No
|
No
|
Scheduling
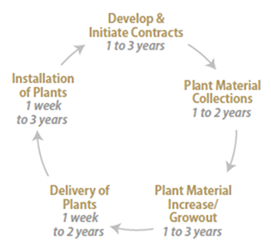 Figure 3-97 | Early planning for plant material procurement
 - The Target Plant Concept identifies six requirements for establishing native plants. Adapted from Landis 2009
Timing is a key factor for obtaining plant materials because many native plants or seeds are not widely available from nurseries and seed companies. Even if a species is available, the odds are that it is not from a local source that is genetically adapted to the project site. Therefore, it is essential to identify plant material needs early. It usually takes a lead time of two to four years to administer seed collection, seed increase, and seedling propagation contracts. Sometimes three years may be required to achieve sufficient quantities of seeds. Plants (seedlings, cuttings, and so on) ordered from nurseries take a great deal of advanced planning for both seed collection and for plant propagation. Failure to realize the lead time necessary for seed collection and propagation of appropriate native plant materials is one of the most common mistakes made in revegetation projects (Figure 3-97).
Select Installation and Maintenance Methods
Many methods are available for installing plant materials on a project site. Seeds can be applied through hydroseeding equipment, disked or drilled into the soil surface, broadcast sown, imprinted, and/or covered with a variety of types of mulch. A variety of techniques are also available for installing cuttings and plants, including an expandable stinger (Figure 5-118), waterjet stinger, pot planter, auger, and a shovel. These methods are discussed in Chapter 5.
Care is necessary after plant materials have been installed to ensure they become well-established. This includes protection from browsing animals, high temperatures, winds, competing vegetation, and drought. Measures that can mitigate for browsing animals include installing netting and tree shelters, over-planting to compensate for expected browse, as well as applying animal repellents. If netting or tree shelters are used, it is important to account for their removal in the implementation budget and contract. Seedlings can be protected from high temperatures and wind with shade cards, tree shelters, and large obstacles, such as logs. Competing vegetation is controlled through weeding, mulch, or herbicides. In extremely dry conditions, soil moisture can be supplemented by using irrigation systems.
3.14.2 DETERMINE OUTPLANTING WINDOWS
In addition to ensuring enough lead time to successfully carry out native revegetation goals, it is necessary to determine the optimum seasons for planting. There are advantages and disadvantages to carrying out operations at any time of the year, and determining the timeframe is based on the species, plant material, and site factors.
 Figure 3-98 | Survivorship can vary between spring and fall plantings
 - The Target Plant Concept identifies six requirements for establishing native plants. Adapted from Landis 2009
The optimum time of year to outplant for greatest plant survival is called the outplanting window. It is determined by graphing the annual precipitation, temperatures, and snow accumulation of a site. This information can be obtained from climate stations, as described in Phase One. Outplanting windows are also defined by the species, stocktype, and outplanting methods. For example, two different species of bunch grass might have very different survival rates depending on when they were outplanted. Figure 3-98 shows survival rates for bluebunch wheatgrass (Pseudoroegneria spicata), that survived better when planted in fall, and spreading needlegrass (Achnatherum richardsonii), that survived better when planted in spring.
Several factors are important for determining outplanting windows, including soil temperatures in late winter and early spring, precipitation during spring and early summer, soil temperatures in fall, precipitation in fall, and snow cover. Three examples of identifying outplanting windows are provided in Figure 3-99, Figure 3-100, and Figure 3-101. Applying the following set of guidelines to the climate data will help clarify the optimum times to plant.
Soil Temperatures in Late Winter and Spring
Seedlings have to develop new roots soon after they are planted to become established and survive the hot (and in many regions, dry) summer of the first growing season. For most species, new root growth occurs when soil temperatures exceed 42° F. Waiting for soil temperatures to warm to 42°F in the spring before outplanting, however, will shorten the period when soil moisture is available to the seedling. For this reason, a common restoration strategy is to outplant seedlings as soon after the last threat of a deep frost in the winter has passed, even if the soil temperatures are below 42° F.
Precipitation in Spring and Summer
Much of the western United States experiences dry summers, with winters receiving most of the precipitation. Under this regime, soils lose their moisture in the summer and recharge from storms that occur in the fall and winter. Plants have adapted to this climate by growing new roots and leaves during spring, when soil moisture is high, and becoming dormant in summer, when soil moisture is depleted. The most critical factor for seedlings that are outplanted in the spring is the length of time available for the seedling to develop new roots before soil moisture is depleted. Sites with little or no precipitation in the spring or summer will dry out faster than sites with high spring and summer precipitation. A guideline is that an average monthly precipitation of less than 1.5 inches will do little to recharge a dry soil during late spring through fall. Figure 3-99, Figure 3-100, and Figure 3-101 show spring outplanting windows for three very different project sites. On low elevation sites west of the Cascade Mountains, the planting window can be fall and spring (Figure 3-99), whereas high elevation sites might have a planting window only in late spring (Figure 3-101).
Soil Temperatures in Fall
If outplanting is planned for late summer or early fall, it is important that soils have high moisture and temperatures are warm enough to encourage new roots to grow into the soil before winter arrives. On cold sites where seedlings are not protected by snow, the upper portions of the soil profile will typically freeze (e.g., frost heave) and can dislodge seeds or seedlings exposing roots to desiccation. Fall outplanted seedlings that have not established new roots below the frost line risk desiccation by wind or sun exposure in winter because little to no water is available to the seedling. Soil temperatures that remain above 42° F for at least one month after seedlings are planted in the fall will help ensure greatest success for root development and seedling establishment prior to winter. Figure 3-101 shows a late summer planting window on a high elevation site where precipitation is high in September and soil temperatures are above 42° F.
Soil temperatures are significantly warmer on south aspects, which means that outplanting windows on south exposures are often temporally broad and extend further into the fall than planting sites on north aspects, given soil moisture is adequate for root growth. Weather stations do not report soil temperatures. However, they can be extrapolated from average monthly air temperatures with a certain degree of reliability. Placing recording thermometers in the soil before construction will give more exact soil temperatures.
Precipitation in Fall
When outplanting seedlings in the fall, high soil moisture is essential for seedling survival and growth. Fall soil moisture can be very low, and the only means of recharging a dry soil is through rainstorms or irrigation. Two or more inches of rain over a period of at least several days are often required to moisten most dry soils. Many sites in the western United States, however, seldom have rainstorm events great enough to moisten the top 12 inches of soil before cold soil temperatures occur. Fall planting on these sites has a low potential for seedling survival. On sites with sufficient fall precipitation, planting windows are open as soon as a rainstorm event wets the surface 12 inches of soil.
Snow Cover
Since seedlings generally are not planted through snow, outplanting windows are open before snow accumulation and after snowmelt. Be aware, however, that cold water from melting snow keeps soil temperatures low. Consider monitoring soil temperatures during or following snowmelt.
Determine Sowing Windows
The outplanting windows for seed sowing may be different than those for planting nursery stock. Optimum planting times for seeds are called “sowing windows.” Sowing windows change by site environment, sowing methods, and seed needs. Seeds will germinate and develop into healthy, viable plants when: seed stratification requirements are met and seeds are in a warm, moist environment during germination. Seed stratification needs a cold, moist period, ranging from a few weeks to several months, during which time the seeds are conditioned for germination. This usually occurs naturally in the western United States during early to mid-spring, but it can be induced artificially in seed coolers.
After seed stratification needs have been met, a moist, warm period must follow in which seeds and soil do not appreciably dry down. Drying during this time can prevent germination and kill new germinants. In the western United States, these conditions are best met by sowing seeds in late summer to early fall. On warm, moist sites (Figure 3-99), seeds that require a very short stratification period will germinate in early fall and begin to establish ground cover before winter rains occur. Fall-sown seeds requiring stratification will have moisture and temperature requirements met during winter. On drier sites (Figure 3-100), fall-sown seeds will not germinate due to lack of precipitation.
If fall sowing is not possible, sowing can take place in late winter or early spring. Sowing at this time generally results in less vigorous stands of grass and forb seedlings because there is a shorter period of favorable conditions for seeds to germinate and seedlings to become established. Another drawback of spring sowing is that some species will not receive the necessary cold, moist period to break seed dormancy and germinate. Once germination has occurred, several months of periodic precipitation with average air temperatures exceeding 40° F are required for successful establishment of ground cover.
Spring sowing can be enhanced in several ways. A mulch applied over the seeds will help maintain higher seed moisture levels and keep soil moisture in the soil for a longer period. Seeds requiring stratification can be artificially stratified for spring sowing to achieve earlier germination. Care is taken to see that the seeds do not mold or begin to germinate during this period, or dry down for sowing. The effect of hydromulch equipment on germinating native species seeds is unknown at this time; seeds may be damaged if sown using this method.
Back to top
3.15 DEVELOP A REVEGETATION PLAN
The last step in the planning process is to write a revegetation plan which is the blue print for successfully implementing a revegetation project. It contains project objectives, site treatments details, plant species that will be used, and planting methods. This document is referred to during project implementation by contractors, contract inspectors, and road project engineers, as to what will be done and the reasoning behind the action. Managers refer to it for roles and responsibilities, timelines, and budgets and it is often shared with maintenance and operations personnel in case there are special maintenance requirements for that section of road. Because revegetation projects often exceed five years, from start to finish, planning personnel may not be available during or after implementation for consultation or perspective and the revegetation plan may be all the construction engineer, road builder, revegetation contractor, and monitoring personnel may have as background for the project.
Developing a revegetation plan has the added benefit of forcing the designer and the teams the designer works with to think more clearly about the project. In the process of developing a revegetation plan, for instance, subjects that may not have been fully addressed during meetings, are discussed at greater depth resulting in better decisions. Another important aspect of this document is that when a draft plan is sent around to managers, maintenance personnel, engineers, and other teams for review, the comments that are returned to the designer are considered and appropriate changes made to the document. There may be several drafts that are made to a revegetation plan and each draft documents the thinking that went into the plan. Not only does this process record decisions, it creates ownership and understanding of the project by others. It is not uncommon for the best ideas to come from organizing and writing a revegetation plan. So, the revegetation plan is more than a report, it encapsulates the process for how a revegetation project was developed.
There is no size or set format for a revegetation plan but there are elements that may be common to all. These include a summary of the:
- Revegetation objectives and desired future conditions (DFC targets)
- Vegetation, soils, and climate of disturbed and undisturbed sites
- Revegetation unit map and unit description
- limiting factors & site resources
- Site improvement treatments
- Contract specifications
- Species & plant materials tableSeed sources
- Planting and seeding plans
- Monitoring
- Schedule
- Budget
- Roles and responsibilities
- Maintenance strategy
Chapter 4 gives an example of a revegetation plan that is specific to developing pollinator habitat. Other examples of revegetation plans can be viewed on the Native Revegetation Resource Library by typing “revegplan” into the search field.
Back to top

